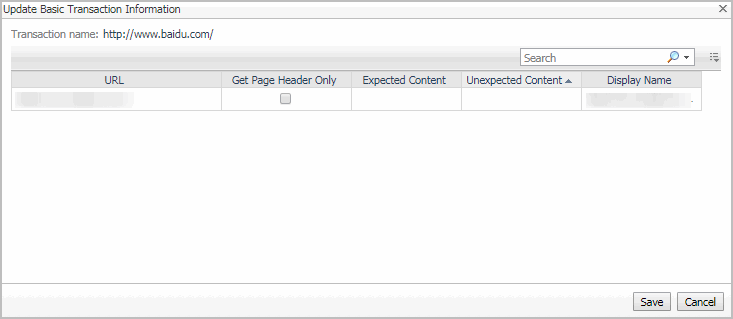
To edit transaction details:
|
• |
|
• |
To start monitoring this Web site with a new set of monitoring agents, in the Monitoring Location view, click Edit. |
|
• |
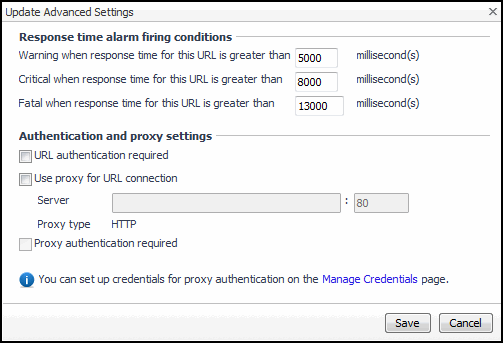
To specify different thresholds for alarm generation, or authentication and proxy settings, in the Advanced Settings view, click Edit. |
|
2 |
Click Save. |
Investigating the performance of Web transactions and monitoring locations
You can access this dashboard from the navigation panel. Under Dashboards, click Web Monitor > Performance Browser.
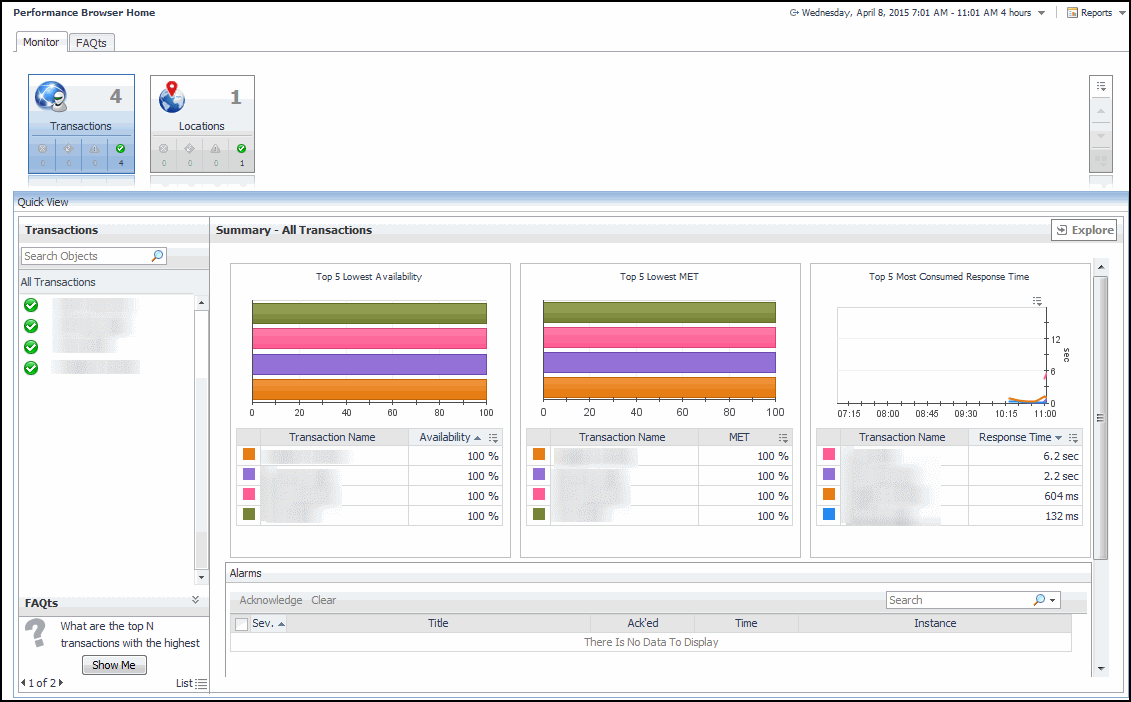
When you navigate to the Performance Browser for the first time, the Monitor tab, described in this topic, appears open. This tab provides an overall summary of your monitored environment. The FAQts tab is also available. For more information about this tab, see Exploring the FAQts tab.
Start by indicating the type of objects you want to investigate. To do that, select the appropriate tile at the top of the Monitor tab, Transactions or Locations. This causes the Quick View to display information about the selected objects. Next, select an object or group of objects in the Quick View, such as All Transactions or All Locations, to display additional information about that selection. For example, selecting all transactions identifies the locations with the lowest availability, the lowest MET (met expected time) data, and the highest consumed response time. For complete information about the data appearing on the Performance Browser, see Web Monitor Performance Browser views.
For more information, see the following topics:
Exploring the FAQts tab
The FAQts tab available on the Performance Browser allows you to review frequently asked questions about your monitored systems and their answers. The Categories view shows several question categories. Selecting a category shows the questions belonging to that category in the Questions pane. From there, clicking a question shows the answer on the right.
For complete information about the data appearing on this tab, see FAQts tab.
Drilling down on transactions
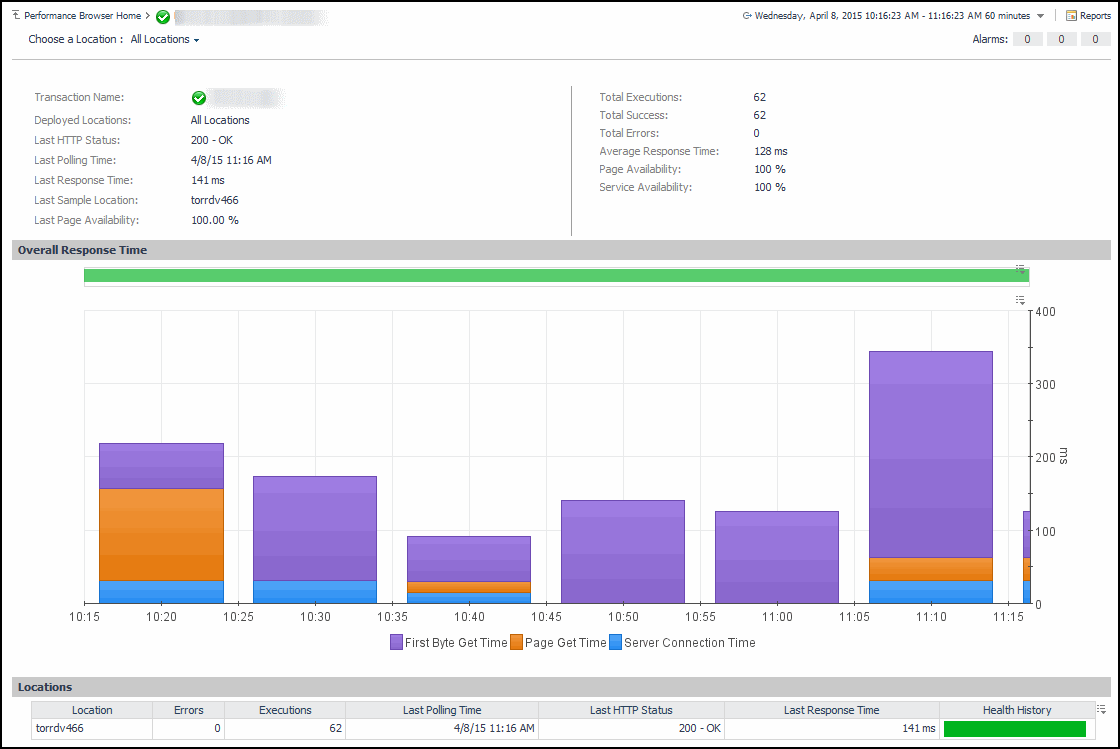
The All Locations drilldown view, displayed by default, allows you to review a larger set of metrics about the selected transaction, and to see how well that transaction is performing when monitored from different locations. Comparing the performance metrics collected from different locations can give you a general view of the responsiveness of your Web sites, and to indicate potential problems at locations that show response issues, and as such might require further investigation. For complete information about the data appearing on this view, see Transaction at All Locations drilldown view.
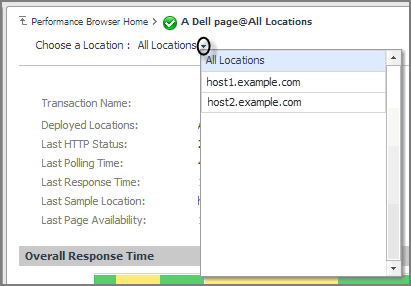
From here, you can drill down on a particular location and review its overall performance. To do that, click the down-facing arrow on the right of Choose a Location, and select a location from the list that appears.
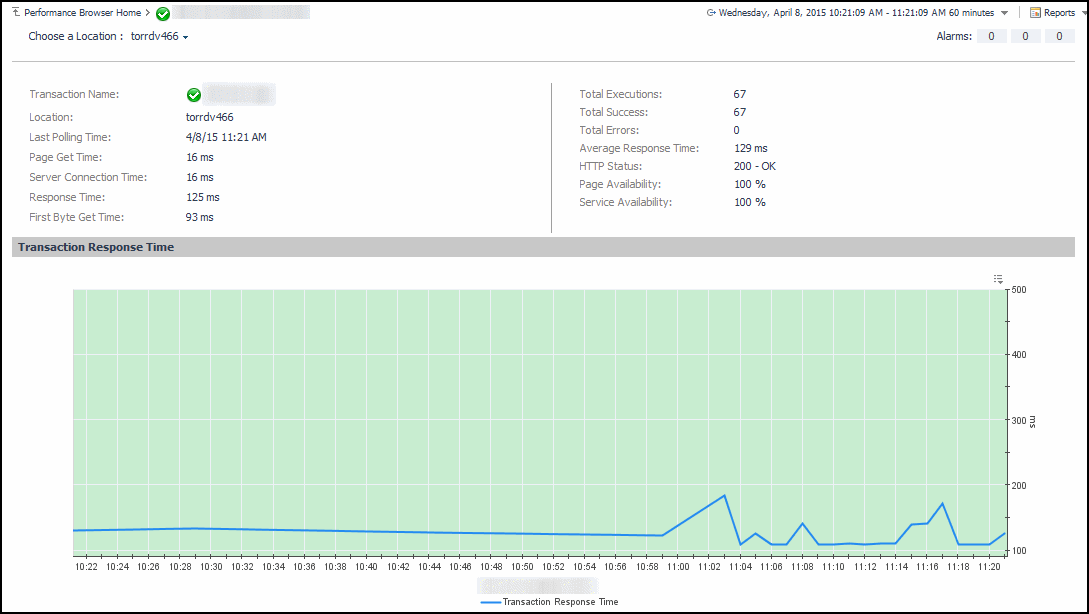
The top part of this view show a number of metrics resulted from monitoring that transaction from the selected location. The bottom part of this view shows a graph indicating the total transaction response times over the selected time range. High peaks in the graph often suggest potential bottlenecks and likely need to be investigated. For complete information about the data appearing on this view, see Transaction at a Selected Location drilldown view.

