Converse agora com nosso suporte
Chat com o suporte

Foglight for Infrastructure 7.1.0 - Foglight for Web Monitor User and Reference Guide

Monitoring Web transactions Exploring your collection of monitored Web sites Investigating the performance of Web transactions and monitoring locations Exploring Web Monitor services Generating reports Configuring Web Monitor agent properties View reference
Web Monitor Performance Browser views Web Monitor Transaction Management views Web Monitor Service Operation Console and Foglight for APM Transactions views

Monitoring Web transactions

Foglight Web Monitor allows you to monitor Web site response times and to investigate service levels that show the signs of potential performance problems, when monitored from specific points in your environment.

When you deploy Foglight Web Monitor, a set of predefined dashboards enables you to view the performance of the monitored Web sites. They allow you to ensure consistent Web server performance by reviewing the performance statistics. Better management of your Web sites can be achieved when you are alerted of potential problems before end users are affected.

Foglight Web Monitor relies on the Web Monitor Agent to collect data. The agent collects transaction information from specified URLs. Given a collection of URLs and a pre-defined collection schedule, the Web Monitor Agent attempts to connect to these Web sites, gathering response time data and sending it back to the Management Server on each data collection attempt.

Start by installing Foglight Web Monitor on the Management Server, deploying the Web Monitor Agent package, and creating agent instances on one or more hosts. For installation instructions, see the Foglight Infrastructure Utilities Release Notes.

If you are planning to monitor transactions from any Web sites that require user authentication, you need to configure appropriate user credentials. For more information, see Configuring credentials for Web sites requiring user or proxy authentication.

At this point you have an option of providing to the agent the list of URLs that you want to monitor, or you can do that later using the Transaction Management dashboard. In addition to managing the collection of monitored Web sites, this dashboard allows you to drill down on individual Web site transaction details, edit the settings that control alarm generation, and provide authentication details, when needed. For more information, see Exploring your collection of monitored Web sites.

Next, navigate to the Performance Browser. This dashboard displays the state of your system performance, providing a visual representation of the status of the monitored transactions and locations. Using this dashboard on a daily basis you can obtain an in-depth understanding of the state of your monitored environment. Monitoring the same collection of Web sites from different agent locations allows you to rule out any issues that may be related to host connectivity rather than Web site response issues. For more information, see Investigating the performance of Web transactions and monitoring locations.

The Web Monitor Agent is equipped with a set of properties that affect its running state. You can make changes to them, as required. For more information about the Web Monitor Agent properties, see Configuring Web Monitor agent properties.

For additional information, see the following topics:

Configuring credentials for Web sites requiring user or proxy authentication

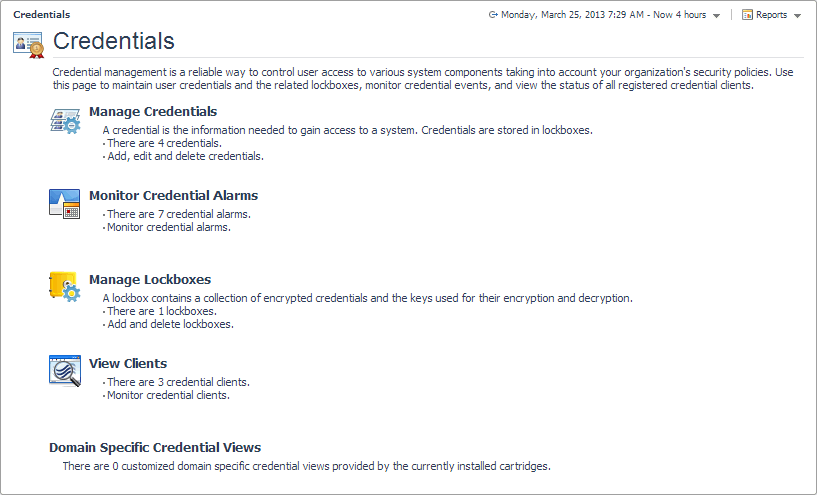
Monitoring Web sites that require user or proxy authentication requires some additional configuration. To successfully access these sites with the Web Monitoring Agent and collect response time metrics, you must provide the credentials these pages need to access them. A valid credential contains a user name and password that enables the Web Monitoring Agent to access the monitored Web site. You can create credentials using the Manage Credentials dashboard.

To get started with managing credentials:

2
On the navigation panel, under Dashboards, click Administration > Credentials.
3

For complete information about credentials, see the Administration and Configuration Help.

For more information, see the following topics:

Ferramentas de autoatendimento
Base de conhecimento
Notificações e alertas
Suporte a produtos
Downloads de software
Documentação técnica
Fóruns de usuário
Tutorial em vídeo
Feed RSS
Fale conosco
Obtenha assistência de licenciamento
Suporte técnico
Visualizar tudo
Documentos relacionados

The document was helpful.

Selecione a classificação

I easily found the information I needed.

Selecione a classificação