Converse agora com nosso suporte
Chat com o suporte

Foglight for Infrastructure 7.1.0 - Foglight for Web Monitor User and Reference Guide

Monitoring Web transactions Exploring your collection of monitored Web sites Investigating the performance of Web transactions and monitoring locations Exploring Web Monitor services Generating reports Configuring Web Monitor agent properties View reference
Web Monitor Performance Browser views Web Monitor Transaction Management views Web Monitor Service Operation Console and Foglight for APM Transactions views

Location view

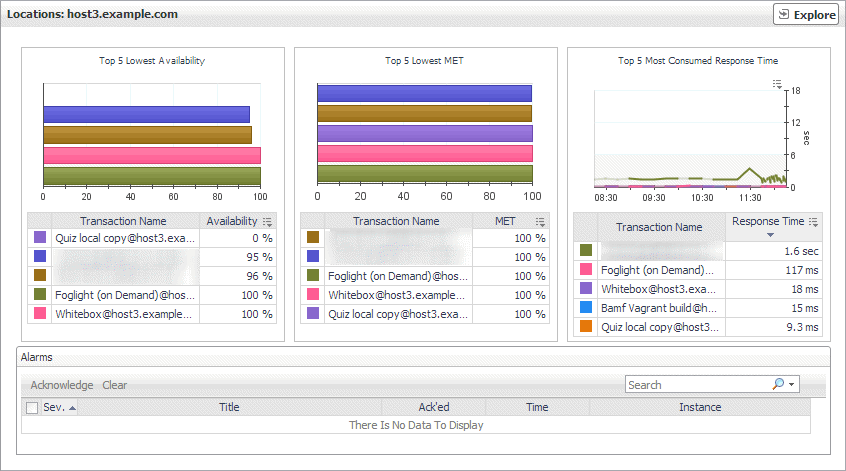
The Location view displays overall response and availability information for the transactions monitored from the selected location. It also identifies the transactions with the lowest availability, lowest MET (met expected time), and highest response time, showing the top five transactions in each of these categories. Use this view to identify the Web sites with degraded performance, and to perform further investigation.
2
In the Quick View, in the Locations view, select a location.
The Location view appears on the right.

This view is made up of the following embedded views:

Table 5. Alarms view

Lists the alarms generated against the selected location.

NOTE: To acknowledge or clear one or more alarms appearing in this table, select them and click Acknowledge or Clear, as required. For more information about alarms in Foglight, see the Foglight User Guide.
Ack’ed. Indicates if the alarm is acknowledged: true or false.
Instance. The name of the transaction against which the alarm is generated.
Severity. Indicates the alarm severity: Warning , Critical , or Fatal .
Time. The time at which the alarm is generated.
Title. The name of the rule that generated the alarm.

Drill down on:

Any row in this table. Displays the Alarm dialog box, showing additional information about the alarm. For more information about alarms in Foglight, see the Foglight User Help.

Shows the top five transactions with the lowest availability.

Availability. The percentage of times the Web site was available when the Web Monitor Agent attempted to collect information from it.
Transaction Name. The transaction name, associated with the monitored URL.

Drill down on:

Shows the top five transactions with the lowest MET.

MET. The percentage of times the Web site meets its acceptable time expected by the end user.
Transaction Name. The transaction name, associated with the monitored URL.

Drill down on:

Shows the top five transactions with the highest response time.

Response Time. The amount of time the Web site takes to respond to the Web Monitor Agent request.
Transaction Name. The transaction name, associated with the monitored URL.

Drill down on:

Table 5. Alarms view

The Location view displays overall response and availability information for the transactions monitored from the selected location. It also identifies the transactions with the lowest availability, lowest MET (met expected time), and highest response time, showing the top five transactions in each of these categories. Use this view to identify the Web sites with degraded performance, and to perform further investigation.

2
In the Quick View, in the Locations view, select a location.
The Location view appears on the right.

This view is made up of the following embedded views:

Table 5. Alarms view

Lists the alarms generated against the selected location.

NOTE: To acknowledge or clear one or more alarms appearing in this table, select them and click Acknowledge or Clear, as required. For more information about alarms in Foglight, see the Foglight User Guide.
Ack’ed. Indicates if the alarm is acknowledged: true or false.
Instance. The name of the transaction against which the alarm is generated.
Severity. Indicates the alarm severity: Warning , Critical , or Fatal .
Time. The time at which the alarm is generated.
Title. The name of the rule that generated the alarm.

Drill down on:

Any row in this table. Displays the Alarm dialog box, showing additional information about the alarm. For more information about alarms in Foglight, see the Foglight User Help.

Shows the top five transactions with the lowest availability.

Availability. The percentage of times the Web site was available when the Web Monitor Agent attempted to collect information from it.
Transaction Name. The transaction name, associated with the monitored URL.

Drill down on:

Shows the top five transactions with the lowest MET.

MET. The percentage of times the Web site meets its acceptable time expected by the end user.
Transaction Name. The transaction name, associated with the monitored URL.

Drill down on:

Shows the top five transactions with the highest response time.

Response Time. The amount of time the Web site takes to respond to the Web Monitor Agent request.
Transaction Name. The transaction name, associated with the monitored URL.

Drill down on:

Table 6. Top 5 Lowest Availability view

The Location view displays overall response and availability information for the transactions monitored from the selected location. It also identifies the transactions with the lowest availability, lowest MET (met expected time), and highest response time, showing the top five transactions in each of these categories. Use this view to identify the Web sites with degraded performance, and to perform further investigation.

2
In the Quick View, in the Locations view, select a location.
The Location view appears on the right.

This view is made up of the following embedded views:

Table 5. Alarms view

Lists the alarms generated against the selected location.

NOTE: To acknowledge or clear one or more alarms appearing in this table, select them and click Acknowledge or Clear, as required. For more information about alarms in Foglight, see the Foglight User Guide.
Ack’ed. Indicates if the alarm is acknowledged: true or false.
Instance. The name of the transaction against which the alarm is generated.
Severity. Indicates the alarm severity: Warning , Critical , or Fatal .
Time. The time at which the alarm is generated.
Title. The name of the rule that generated the alarm.

Drill down on:

Any row in this table. Displays the Alarm dialog box, showing additional information about the alarm. For more information about alarms in Foglight, see the Foglight User Help.

Shows the top five transactions with the lowest availability.

Availability. The percentage of times the Web site was available when the Web Monitor Agent attempted to collect information from it.
Transaction Name. The transaction name, associated with the monitored URL.

Drill down on:

Shows the top five transactions with the lowest MET.

MET. The percentage of times the Web site meets its acceptable time expected by the end user.
Transaction Name. The transaction name, associated with the monitored URL.

Drill down on:

Shows the top five transactions with the highest response time.

Response Time. The amount of time the Web site takes to respond to the Web Monitor Agent request.
Transaction Name. The transaction name, associated with the monitored URL.

Drill down on:

Table 7. Top 5 Lowest MET view

The Location view displays overall response and availability information for the transactions monitored from the selected location. It also identifies the transactions with the lowest availability, lowest MET (met expected time), and highest response time, showing the top five transactions in each of these categories. Use this view to identify the Web sites with degraded performance, and to perform further investigation.

2
In the Quick View, in the Locations view, select a location.
The Location view appears on the right.

This view is made up of the following embedded views:

Table 5. Alarms view

Lists the alarms generated against the selected location.

NOTE: To acknowledge or clear one or more alarms appearing in this table, select them and click Acknowledge or Clear, as required. For more information about alarms in Foglight, see the Foglight User Guide.
Ack’ed. Indicates if the alarm is acknowledged: true or false.
Instance. The name of the transaction against which the alarm is generated.
Severity. Indicates the alarm severity: Warning , Critical , or Fatal .
Time. The time at which the alarm is generated.
Title. The name of the rule that generated the alarm.

Drill down on:

Any row in this table. Displays the Alarm dialog box, showing additional information about the alarm. For more information about alarms in Foglight, see the Foglight User Help.

Shows the top five transactions with the lowest availability.

Availability. The percentage of times the Web site was available when the Web Monitor Agent attempted to collect information from it.
Transaction Name. The transaction name, associated with the monitored URL.

Drill down on:

Shows the top five transactions with the lowest MET.

MET. The percentage of times the Web site meets its acceptable time expected by the end user.
Transaction Name. The transaction name, associated with the monitored URL.

Drill down on:

Shows the top five transactions with the highest response time.

Response Time. The amount of time the Web site takes to respond to the Web Monitor Agent request.
Transaction Name. The transaction name, associated with the monitored URL.

Drill down on:

Documentos relacionados

The document was helpful.

Selecione a classificação

I easily found the information I needed.

Selecione a classificação