Converse agora com nosso suporte
Chat com o suporte

Foglight for Infrastructure 7.1.0 - Foglight for Web Monitor User and Reference Guide

Monitoring Web transactions Exploring your collection of monitored Web sites Investigating the performance of Web transactions and monitoring locations Exploring Web Monitor services Generating reports Configuring Web Monitor agent properties View reference
Web Monitor Performance Browser views Web Monitor Transaction Management views Web Monitor Service Operation Console and Foglight for APM Transactions views

Table 24. General Info view

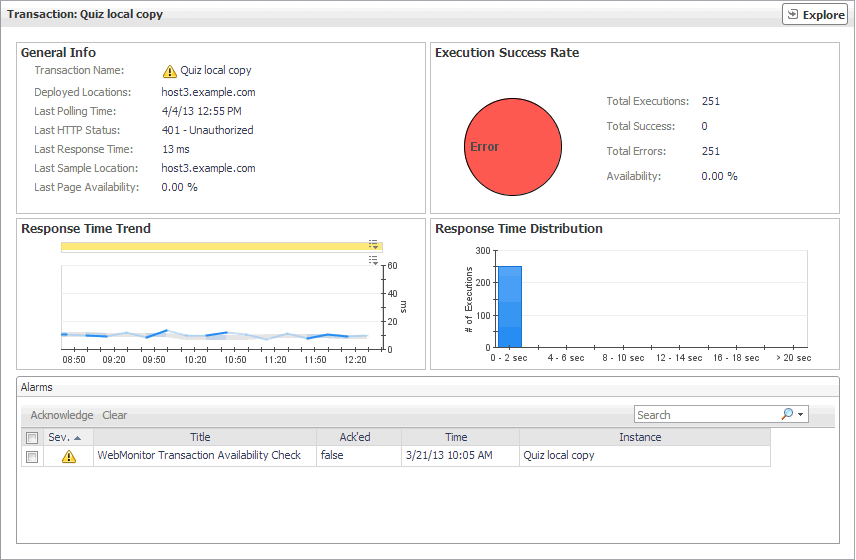
The Transaction view displays overall response and availability information for the selected transaction. Use it to get a better idea of how well this Web site is performing and to investigate potential bottlenecks.

o

2
In the Quick View, in the Transactions view, select a transaction.
The Transaction view appears on the right.

This view is made up of the following embedded views:

Table 23. Alarms view

Lists the alarms generated against the selected transaction.

NOTE: To acknowledge or clear one or more alarms appearing in this table, select them and click Acknowledge or Clear, as required. For more information about alarms in Foglight, see the Foglight User Guide.
Ack’ed. Indicates if the alarm is acknowledged: true or false.
Instance. The name of the transaction against which the alarm is generated.
Severity. Indicates the alarm severity: Warning , Critical , or Fatal .
Time. The time at which the alarm is generated.
Title. The name of the rule that generated the alarm.

Drill down on:

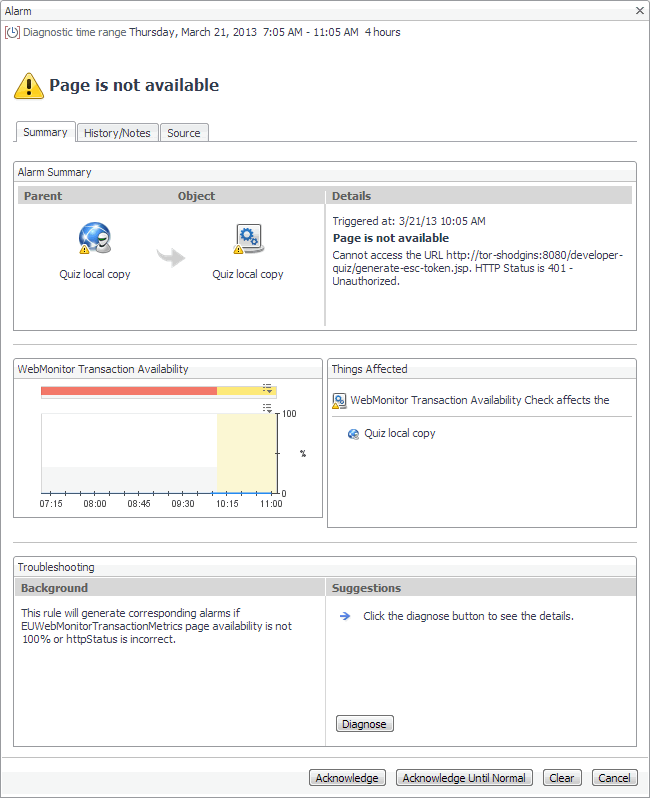
Any row in this table. Displays the Alarm dialog box, showing additional information about the alarm. For more information about alarms in Foglight, see the Foglight User Help.

Shows general details about the most recent collection attempt.

Deployed Locations. The names of the hosts running the instances of the Web Monitor Agent configured to monitor this Web site.
Last HTTP Status. The most recent HTTP status code, indicating the result of the most recent transaction with the monitored Web site.
Last Page Availability. The percentage of time the Web site was available when the Web Monitor Agent attempted to collect information from it during the most recent data collection attempt.
Last Polling Time. The date and time of the most recent data collection.
Last Response Time. The amount of time the Web Monitor Agent waited for a response from the monitored Web site during the most recent data collection attempt.
Last Sample Location. The name of the host running the Web Monitor Agent instance that performed the most recent data collection from this Web site.
Transaction Name. The transaction name, associated with the monitored URL.

Indicates the general success rate the monitoring agents encountered during data collection.

Availability. The percentage of time the Web site was available when the Web Monitor Agent instances configured to monitor this Web site attempted to collect information.
Total Errors. The total number of execution attempts that resulted in errors all instances of the Web Monitor Agent configured to monitor this Web site encountered during the selected time range.
Total Executions. The total number of execution attempts all instances of the Web Monitor Agent configured to monitor this Web site performed during the selected time range.
Total Successes. The total number of successful execution attempts all instances of the Web Monitor Agent configured to monitor this Web site encountered during the selected time range.

Indicates the time the Web site takes for responding to monitoring requests and its health.

Health History. A color-coded bar, representing the alarm state of the monitored location over the selected time range. The color of the bar changes depending on the alarm state. Red indicates a Fatal state, orange indicates Critical, yellow means Warning, and green is the Normal State.
Response Time. The amount of time the Web site takes to respond to monitoring requests, over the selected time range. High values in the graph can indicate potential bottlenecks that likely need to be investigated.
The grey-shaded area indicates baseline values for this metric, representing the expected value range during the selected time period.

Shows the distribution of transaction response times. Each rectangle in the histogram represent the number of execution attempts that resulted with the response time in the given range.

Table 25. Execution Success Rate view

The Transaction view displays overall response and availability information for the selected transaction. Use it to get a better idea of how well this Web site is performing and to investigate potential bottlenecks.

o

2
In the Quick View, in the Transactions view, select a transaction.
The Transaction view appears on the right.

This view is made up of the following embedded views:

Table 23. Alarms view

Lists the alarms generated against the selected transaction.

NOTE: To acknowledge or clear one or more alarms appearing in this table, select them and click Acknowledge or Clear, as required. For more information about alarms in Foglight, see the Foglight User Guide.
Ack’ed. Indicates if the alarm is acknowledged: true or false.
Instance. The name of the transaction against which the alarm is generated.
Severity. Indicates the alarm severity: Warning , Critical , or Fatal .
Time. The time at which the alarm is generated.
Title. The name of the rule that generated the alarm.

Drill down on:

Any row in this table. Displays the Alarm dialog box, showing additional information about the alarm. For more information about alarms in Foglight, see the Foglight User Help.

Shows general details about the most recent collection attempt.

Deployed Locations. The names of the hosts running the instances of the Web Monitor Agent configured to monitor this Web site.
Last HTTP Status. The most recent HTTP status code, indicating the result of the most recent transaction with the monitored Web site.
Last Page Availability. The percentage of time the Web site was available when the Web Monitor Agent attempted to collect information from it during the most recent data collection attempt.
Last Polling Time. The date and time of the most recent data collection.
Last Response Time. The amount of time the Web Monitor Agent waited for a response from the monitored Web site during the most recent data collection attempt.
Last Sample Location. The name of the host running the Web Monitor Agent instance that performed the most recent data collection from this Web site.
Transaction Name. The transaction name, associated with the monitored URL.

Indicates the general success rate the monitoring agents encountered during data collection.

Availability. The percentage of time the Web site was available when the Web Monitor Agent instances configured to monitor this Web site attempted to collect information.
Total Errors. The total number of execution attempts that resulted in errors all instances of the Web Monitor Agent configured to monitor this Web site encountered during the selected time range.
Total Executions. The total number of execution attempts all instances of the Web Monitor Agent configured to monitor this Web site performed during the selected time range.
Total Successes. The total number of successful execution attempts all instances of the Web Monitor Agent configured to monitor this Web site encountered during the selected time range.

Indicates the time the Web site takes for responding to monitoring requests and its health.

Health History. A color-coded bar, representing the alarm state of the monitored location over the selected time range. The color of the bar changes depending on the alarm state. Red indicates a Fatal state, orange indicates Critical, yellow means Warning, and green is the Normal State.
Response Time. The amount of time the Web site takes to respond to monitoring requests, over the selected time range. High values in the graph can indicate potential bottlenecks that likely need to be investigated.
The grey-shaded area indicates baseline values for this metric, representing the expected value range during the selected time period.

Shows the distribution of transaction response times. Each rectangle in the histogram represent the number of execution attempts that resulted with the response time in the given range.

Table 26. Response Time Trend view

The Transaction view displays overall response and availability information for the selected transaction. Use it to get a better idea of how well this Web site is performing and to investigate potential bottlenecks.

o

2
In the Quick View, in the Transactions view, select a transaction.
The Transaction view appears on the right.

This view is made up of the following embedded views:

Table 23. Alarms view

Lists the alarms generated against the selected transaction.

NOTE: To acknowledge or clear one or more alarms appearing in this table, select them and click Acknowledge or Clear, as required. For more information about alarms in Foglight, see the Foglight User Guide.
Ack’ed. Indicates if the alarm is acknowledged: true or false.
Instance. The name of the transaction against which the alarm is generated.
Severity. Indicates the alarm severity: Warning , Critical , or Fatal .
Time. The time at which the alarm is generated.
Title. The name of the rule that generated the alarm.

Drill down on:

Any row in this table. Displays the Alarm dialog box, showing additional information about the alarm. For more information about alarms in Foglight, see the Foglight User Help.

Shows general details about the most recent collection attempt.

Deployed Locations. The names of the hosts running the instances of the Web Monitor Agent configured to monitor this Web site.
Last HTTP Status. The most recent HTTP status code, indicating the result of the most recent transaction with the monitored Web site.
Last Page Availability. The percentage of time the Web site was available when the Web Monitor Agent attempted to collect information from it during the most recent data collection attempt.
Last Polling Time. The date and time of the most recent data collection.
Last Response Time. The amount of time the Web Monitor Agent waited for a response from the monitored Web site during the most recent data collection attempt.
Last Sample Location. The name of the host running the Web Monitor Agent instance that performed the most recent data collection from this Web site.
Transaction Name. The transaction name, associated with the monitored URL.

Indicates the general success rate the monitoring agents encountered during data collection.

Availability. The percentage of time the Web site was available when the Web Monitor Agent instances configured to monitor this Web site attempted to collect information.
Total Errors. The total number of execution attempts that resulted in errors all instances of the Web Monitor Agent configured to monitor this Web site encountered during the selected time range.
Total Executions. The total number of execution attempts all instances of the Web Monitor Agent configured to monitor this Web site performed during the selected time range.
Total Successes. The total number of successful execution attempts all instances of the Web Monitor Agent configured to monitor this Web site encountered during the selected time range.

Indicates the time the Web site takes for responding to monitoring requests and its health.

Health History. A color-coded bar, representing the alarm state of the monitored location over the selected time range. The color of the bar changes depending on the alarm state. Red indicates a Fatal state, orange indicates Critical, yellow means Warning, and green is the Normal State.
Response Time. The amount of time the Web site takes to respond to monitoring requests, over the selected time range. High values in the graph can indicate potential bottlenecks that likely need to be investigated.
The grey-shaded area indicates baseline values for this metric, representing the expected value range during the selected time period.

Shows the distribution of transaction response times. Each rectangle in the histogram represent the number of execution attempts that resulted with the response time in the given range.

Table 27. Response Time Distribution view

The Transaction view displays overall response and availability information for the selected transaction. Use it to get a better idea of how well this Web site is performing and to investigate potential bottlenecks.

o

2
In the Quick View, in the Transactions view, select a transaction.
The Transaction view appears on the right.

This view is made up of the following embedded views:

Table 23. Alarms view

Lists the alarms generated against the selected transaction.

NOTE: To acknowledge or clear one or more alarms appearing in this table, select them and click Acknowledge or Clear, as required. For more information about alarms in Foglight, see the Foglight User Guide.
Ack’ed. Indicates if the alarm is acknowledged: true or false.
Instance. The name of the transaction against which the alarm is generated.
Severity. Indicates the alarm severity: Warning , Critical , or Fatal .
Time. The time at which the alarm is generated.
Title. The name of the rule that generated the alarm.

Drill down on:

Any row in this table. Displays the Alarm dialog box, showing additional information about the alarm. For more information about alarms in Foglight, see the Foglight User Help.

Shows general details about the most recent collection attempt.

Deployed Locations. The names of the hosts running the instances of the Web Monitor Agent configured to monitor this Web site.
Last HTTP Status. The most recent HTTP status code, indicating the result of the most recent transaction with the monitored Web site.
Last Page Availability. The percentage of time the Web site was available when the Web Monitor Agent attempted to collect information from it during the most recent data collection attempt.
Last Polling Time. The date and time of the most recent data collection.
Last Response Time. The amount of time the Web Monitor Agent waited for a response from the monitored Web site during the most recent data collection attempt.
Last Sample Location. The name of the host running the Web Monitor Agent instance that performed the most recent data collection from this Web site.
Transaction Name. The transaction name, associated with the monitored URL.

Indicates the general success rate the monitoring agents encountered during data collection.

Availability. The percentage of time the Web site was available when the Web Monitor Agent instances configured to monitor this Web site attempted to collect information.
Total Errors. The total number of execution attempts that resulted in errors all instances of the Web Monitor Agent configured to monitor this Web site encountered during the selected time range.
Total Executions. The total number of execution attempts all instances of the Web Monitor Agent configured to monitor this Web site performed during the selected time range.
Total Successes. The total number of successful execution attempts all instances of the Web Monitor Agent configured to monitor this Web site encountered during the selected time range.

Indicates the time the Web site takes for responding to monitoring requests and its health.

Health History. A color-coded bar, representing the alarm state of the monitored location over the selected time range. The color of the bar changes depending on the alarm state. Red indicates a Fatal state, orange indicates Critical, yellow means Warning, and green is the Normal State.
Response Time. The amount of time the Web site takes to respond to monitoring requests, over the selected time range. High values in the graph can indicate potential bottlenecks that likely need to be investigated.
The grey-shaded area indicates baseline values for this metric, representing the expected value range during the selected time period.

Shows the distribution of transaction response times. Each rectangle in the histogram represent the number of execution attempts that resulted with the response time in the given range.

Documentos relacionados

The document was helpful.

Selecione a classificação

I easily found the information I needed.

Selecione a classificação