ControlPoint Administration Log (xcAdmin.log)
xcAdmin.log:
·is the log file where the following information is recorded:
§ControlPoint application errors
§the progress of both scheduled and interactive Discovery jobs, and
·is accessible from the machine on which ControlPoint was installed for the farm, in the following SharePoint hive subdirectory: \TEMPLATE\LAYOUTS\Axceler\log.
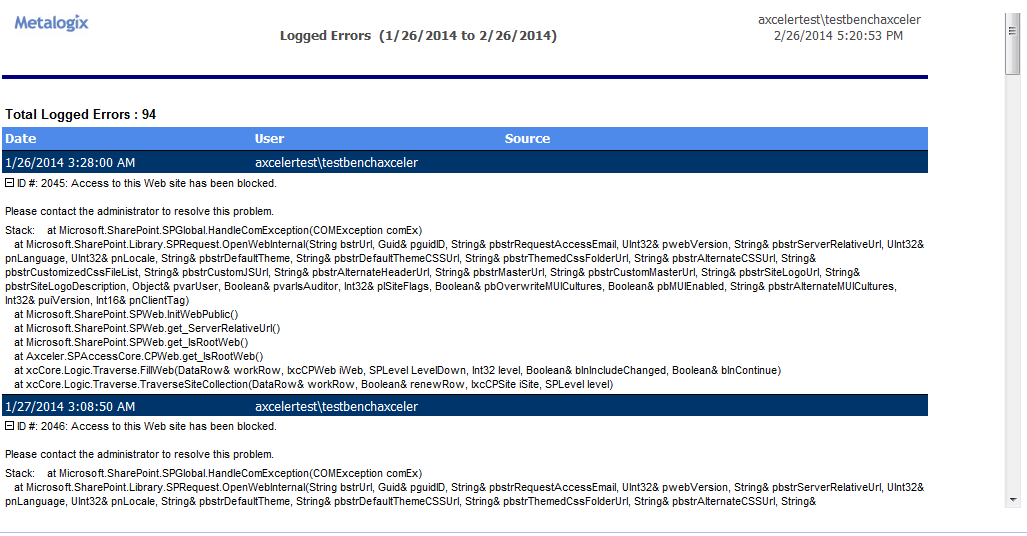
Logged Errors Report
The Logged Errors Report:
·reports ControlPoint application errors for a specified time period, and
·is available from the ControlPoint Actions and Analyses panel.
To generate a Logged Errors Report:
1From the Manage ControlPoint panel, choose Schedule Management and Logging > Logged Errors Report.
2Enter the Start Date and End Date for the time period you want to cover.
Now you can:
·run the analysis immediately (by clicking [Run Now] )
OR
·schedule the analysis to run at a later time
OR
·generate an xml file with instructions that can be run at a later time (by clicking [Save Instructions]). See Saving, Modifying and Running Instructions for a ControlPoint Operation.
The errors returned by this report are similar to those recorded in the Administration log, which is available to ControlPoint Application Administrators. It does not, however, trace activities like the progress of both scheduled and interactive Discovery jobs, as the Administration log does.
Troubleshooting Configuration Errors
Configuration errors generally display in the right (workspace) pane, when you first open the ControlPoint application or when you attempt to run a ControlPoint operation.
Blank Page/Unexpected Error
Possible Reason
If you attempt to open ControlPoint and a blank page displays (with or without a message such as Error or An unexpected error has occurred) it may because your farm uses multiple Web front-end servers and you failed to properly configure the ControlPoint application for all of them.
Resolution
Make sure that the ControlPoint application has been configured for all Web front-end servers. See the ControlPoint Advanced Installation Guide for details.

