The Spotlight Home Page highlights obvious bottlenecks and problem areas. Statistics and flows are updated in real time.
To see the Spotlight Home Page
Click Monitor | Home.

Home Page Components
Each component on the Spotlight Home Page has various associated statistics. Right click on the component for more detail.
Notes:
 on the affected component. Click the icon to see more information about the problem.
 | Right Click | Description |
|---|---|
| What's This? |
Show help on the component. If an alarm has been raised then provide assistance in resolving the alarm. Tip: The help may have a Show Me button. Click Show Me to view numeric detail related to the current state of the component. See "Drilldowns Ribbon Group" (page 1) for more information. Note: The behavior of What's This is configurable. See "Change What Happens When a Home Page Control is Clicked " (page 1) for more information. |
| Show History |
Show the component's history in a popup chart. Use the chart toolbar to zoom and maximize the view. Right-click the chart to set the time frame. For more historical views: See "Playback" (page 1) for more information. |
| Show Details | Show more numerical detail related to the component by opening a related drilldown page. See "Drilldowns Ribbon Group" (page 1) for more information. |
| Copy to Clipboard | Copy numeric data associated with the component to the clipboard. |
| Alarm Settings | Open the Alarms Dialog (page 1) to configure the alarm(s) that can be raised on this component. |
Home Page Components in an alarm state
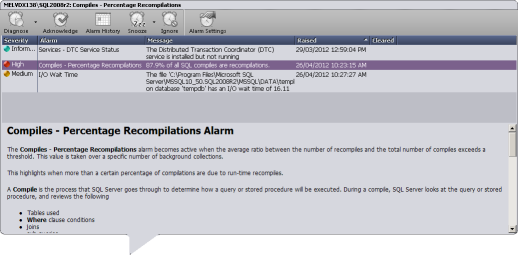
Home page components are colored by alarm. See "Alarm Severity and Color Scheme" (page 1) for more information. To resolve raised alarms from the Spotlight Home Page, click on a component in an alarm state.
| Interface | Description |
|---|---|
| Diagnose | Open the Spotlight drilldown page relevant to diagnosing the alarm. |
| Acknowledge | Acknowledge the (selected) alarm. This is appropriate for alarms that are configured to require acknowledgement. Alarms are configured to require acknowledgement in the Alarms Dialog (page 1). |
| Alarm History | Show the (selected) alarm in Alarms by Time (page 1). |
| Snooze | Temporarily remove the visual alert associated with the (selected) alarm. See Snooze Alarms (page 1) for more information. |
| Alarm Settings | Open the Alarms Dialog (page 1) for the (selected) alarm. |
| Alarm Grid | The grid is shown when multiple alarms are raised against the Spotlight Home Page component. Click on an alarm to select it. The grid is as per the Alarm Log (page 1). |
| Alarm Help | Show help on the (selected) alarm. |
