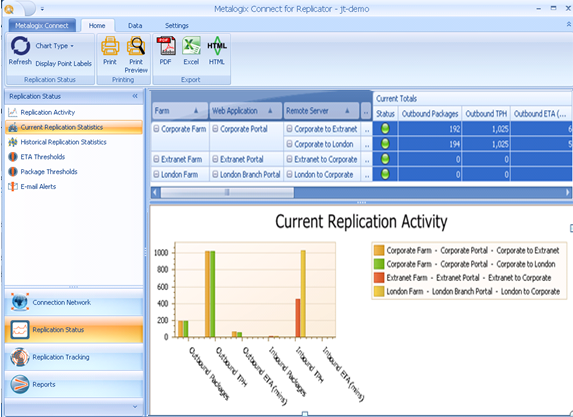
This page is similar to the Replicator Status page. The current replication activity page presents summary statistics for your Replication Network. You can view these statistics with the use of the Current Totals, or the summary of the totals in their chart format. These statistics summarize the Replication Events and Packages that are currently being replicated.
If you have configured ETA or Package thresholds and any of the current statistics exceeds the thresholds, then those values will be marked in the table. Orange values exceed warning thresholds and red values exceed critical thresholds.
The purpose of this page is to provide a summary of package processing for each connection.
Things to look for on this page include:
·Unexpected increase in package count
·Longer than expected processing times
·Whether thresholds have been exceeded
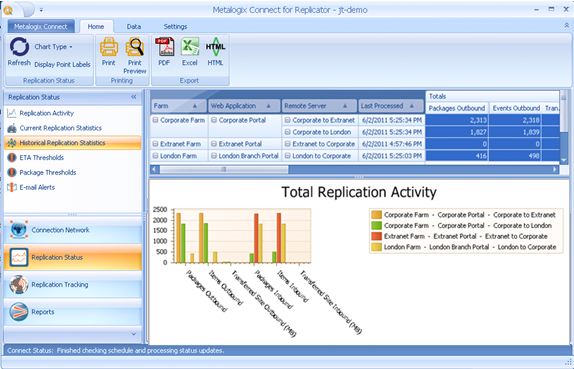
The historical replication statistics page presents summary statistics for your Replication Network. You can view these statistics using the numeric totals and also summarized in a chart.
The purpose of this page is to provide a summary total of package processing.
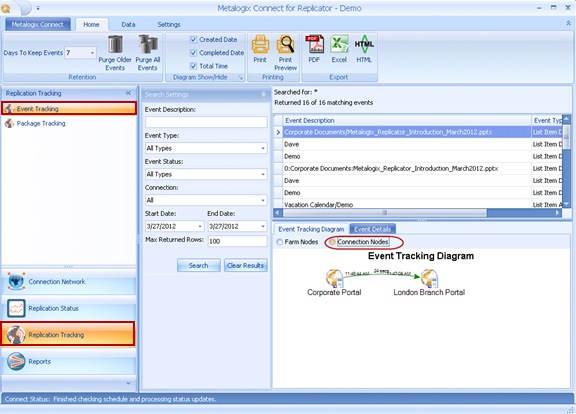
Metalogix Replicator, Enterprise Edition customers can use Connect to track events as they are replicated through your Replication Network.
The purpose of this page is to rack processing by individual events.
Things to look for include:
·Whether events have arrived on target
·The time it takes to replicate events to the target