立即与支持人员聊天
与支持团队交流

Foglight for VMware 5.8 - User and Reference Guide

Using Foglight for VMware
Introducing the virtual infrastructure Navigation basics Interacting with Foglight for VMware VMware Performance Agent configuration
Reference
Views
VMware Alarms views VMware Explorer views VMware Modeler views VMware VirtualCenter views VMware Environment views Other views
Rules
Agent Rules Cluster Rules Datacenter Rules Datastore Rules Resource Pool Rules ESX Server Rules VirtualCenter Rules Virtual Machine Rules VMW Stale Data Management Rule Virtual Switch Rules
Appendix: Alarm Messages Appendix: Metrics

FAQts tab

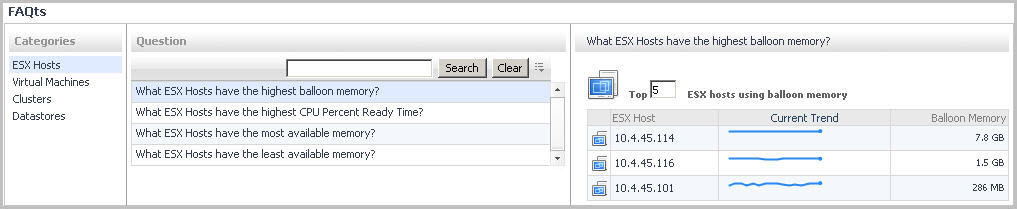
Through three embedded views (the Categories, Question, and Answer views), the FAQts tab enables you to ask Foglight for VMware questions and provides the answers to those questions.

Figure 104. FAQts tab

The FAQts view appears on both the Virtual Environment Summary and VMware Explorer dashboards as a navigation tab.

The FAQts view is made up of the following embedded views:

This view provides an answer to the question selected in the Questions view. The answer appears in the following form:

Top x <objects of category>…

where x is the number of objects of the category you provided in the Categories view.

Specify x by entering a number. The answer is relative to the subset of the infrastructure you are viewing in the dashboard. For example, the top 5 datastores are different for each individual cluster in the infrastructure.

This view lists the categories for which questions can be answered for you by Foglight for VMware.

Click a category in the list to select it.

This view lists the questions, for the category selected in the Categories, that can be answered for you by Foglight for VMware.

Click a question in the list to select it.

If the list of questions is long and you want to narrow it down, search for a particular text string using the Search box.

Instances and Limits view

This view displays the list of the existing VMware object types. This information can give you insight into the size of your database and whether additional adjustments are required to improve your system performance.

On the VMware Environment dashboard, on the Administration tab, click Review Instances and Limits.
The Instances and Limits view appears in the display area.
Instance Count. The current number of object instances of this type.
Instance Limit. The maximum number of object instances of this type that can be instantiated.
Object Type. The type of the topology object.
Status. The current status representing the highest severity level associated with an instance of that type.
Utilized. The percentage of the object limit instance that is currently utilized.

OS Mapping view

You configure OS mapping rules using the OS Mapping view. OS mapping is the mapping of the various versions and editions of a particular operating system to a common OS name. This helps Foglight for VMware manage the variety of versions and editions of each OS.

Figure 106. OS Mapping view

On the VMware Environment dashboard, on the Administration tab, click Configure OS Mapping.
The OS Mapping view appears in the display area.
Common OS Name. The OS name.
Matching String. The OS name to be matched against existing OS names.
Priority. The matching priority. Selecting a mapping and clicking or allows you to edit the priority sequence.

Metrics Collection Management View

The Metrics Collection Management view is used to configure the metrics collect by agent. VMware agent has collect total 99 metrics from vCenter, but some metrics are not used to VMware dashboard and relate products (Capacity Director, Optimizer and so on), less metrics collection can reduce the pressure of collection from vCenter and improve performance for agent on large environment. This view is for this purpose and user can disable the collection of these metrics at this view.

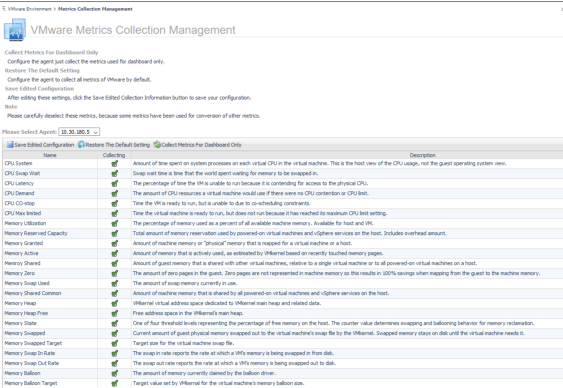
Please select agent: select the agent which need configure.
Collect Metrics For Dashboard Only: Configure the agent just collect the metrics used for dashboard only.
Restore The Default Setting: Configure the agent to collect all metrics of VMware by default.
Save Edited Configuration: After editing these settings, click the Save Edited Collection Information button to save your configuration.

Data displayed

Name: The metrics name.
Collecting: Agent collect this metric or not, agent collect it when it selected.
Description: The description of metric.
相关文档

The document was helpful.

选择评级

I easily found the information I needed.

选择评级