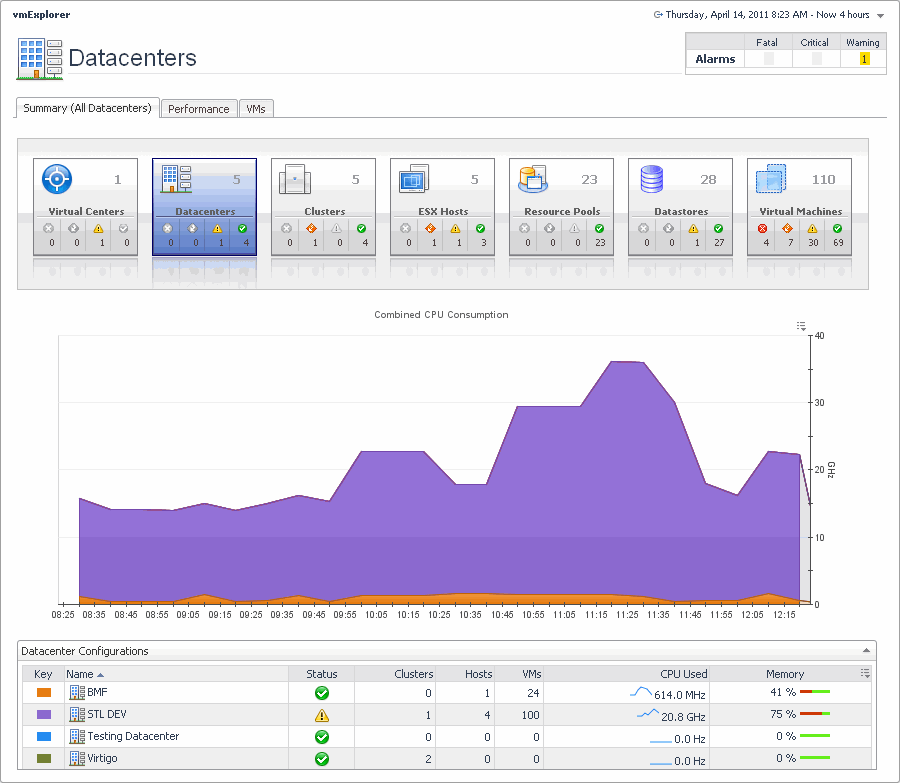
Summary (All Datacenters) tab
The Summary (All Datacenters) tab shows a summary of system resources for all datacenters that currently exist in a selected Virtual Center.

This view is made up of the following embedded views:
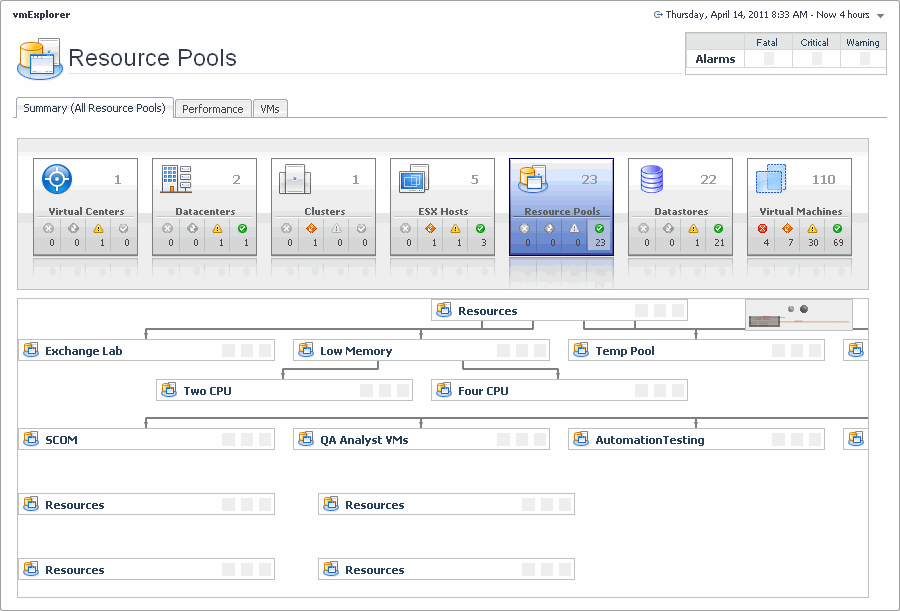
Summary (All Resource Pools) tab
The Summary (All Resource Pools) tab shows a summary of system resources for all resource pools that currently exist in a selected Virtual Center.

This view is made up of the following embedded views:
For complete information about this view, see Resource Pools Relationship Tree view .
This embedded view shows the same information as the Virtual Environment view appearing on the Summary (All Clusters) tab. See page 142 for complete information.
Summary (All Servers) tab
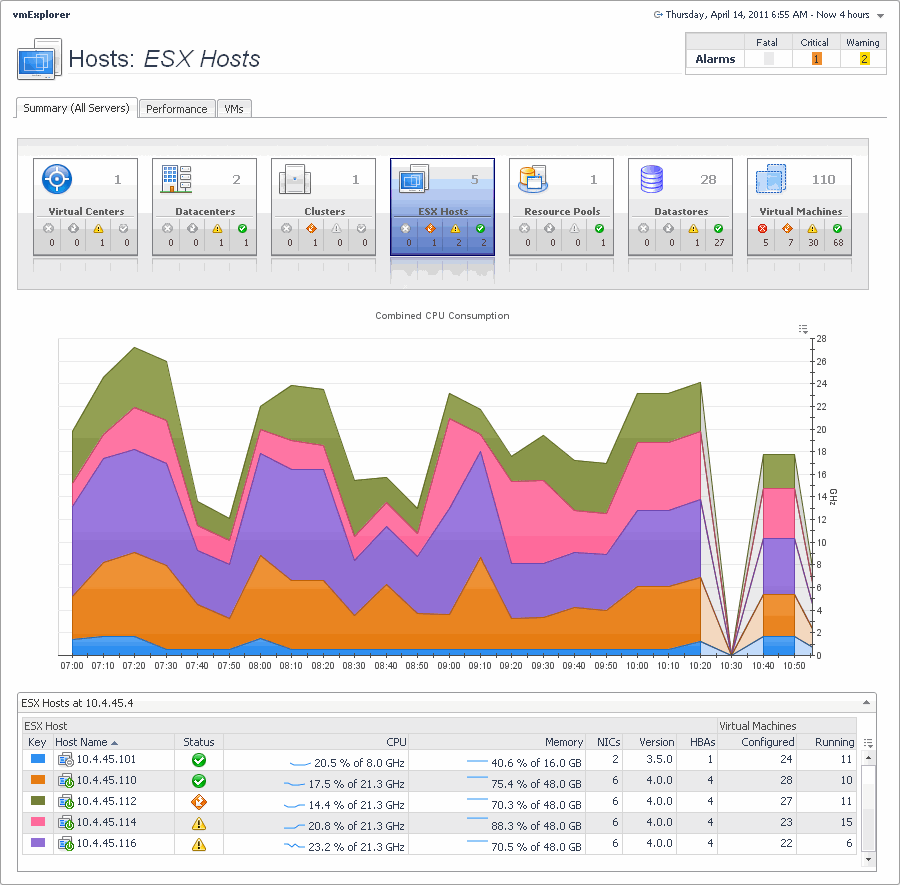
The Summary (All Servers) tab shows a summary of system resources for all ESX hosts that currently exist in a selected Virtual Center.

This view is made up of the following embedded views:
|
|
This tabular view lists all ESX hosts that exist in your environment. |
|
|
|
• |
ESX host, CPU. The current amount of the CPU speed that is used by the ESX host. | |
|
|
|
|
|
|
• |
ESX host, Memory. The current percentage of memory that is used by the ESX host. | |
|
|
|
• |
ESX host, NICs. The number of network interface cards used by the ESX host. | |
|
|
|
|
|
|
• |
ESX host, Status. The ESX host status, associated with any alarms raised against it. If no alarms are fired, the status appears as Normal. Otherwise, the status is set to the highest alarm severity (Warning, Critical, or Fatal). | |
|
|
|
|
|
|
|
|
|
|
|
Drill down on any ESX host entry. The VMware Environment dashboard appears, showing the ESX host details on the Summary tab. |
Summary (All Virtual Machines) tab
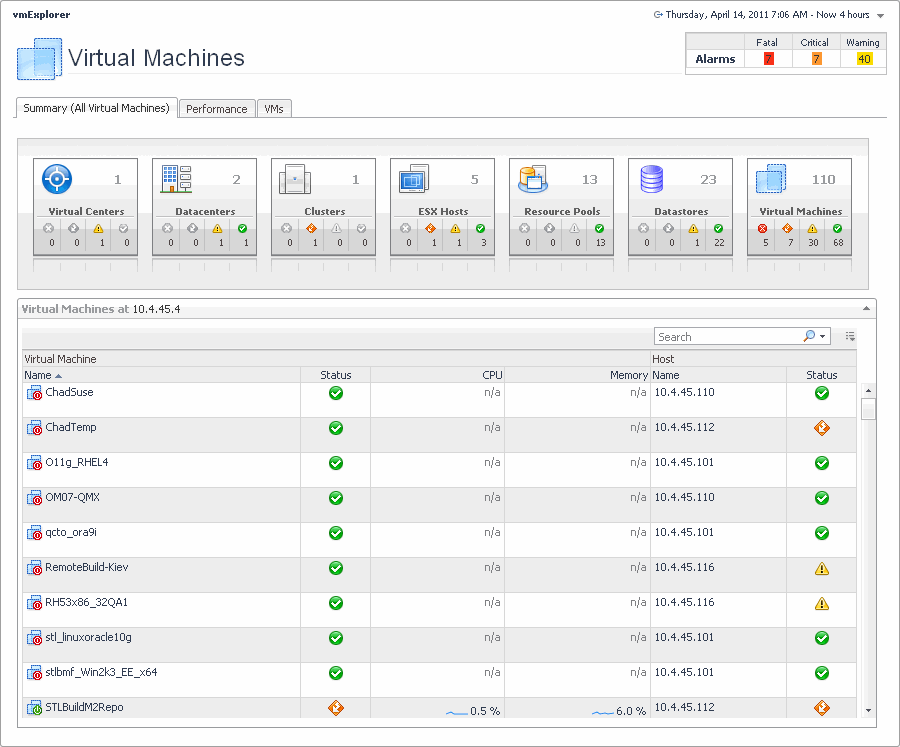
The Summary (All Virtual Machines) tab shows a summary of system resources for all virtual machines that currently exist in the selected Virtual Center.

This view is made up of the following embedded views:
|
|
This tabular view lists all virtual machines that exist in the selected Virtual Center. |
|
|
|
|
|
|
• |
Virtual Machine, Status. The status of the server on which the virtual machine is running, associated with any alarms raised against it. If no alarms are fired, the status appears as Normal. Otherwise, the status is set to the highest alarm severity (Warning, Critical, or Fatal). | |
|
|
|
• |
Virtual Machine, CPU. The percentage of the virtual machine’s CPU utilization spent on executing system code and user programs. | |
|
|
|
|
|
|
• |
Virtual Machine, Status. The virtual machine status, associated with any alarms raised against it. If no alarms are fired, the status appears as Normal. Otherwise, the status is set to the highest alarm severity (Warning, Critical, or Fatal). | |
|
|
|
|
|
Drill down on any virtual machine entry. The VMware Environment dashboard appears, showing the server details on the Summary tab. |