|
1 |
|
3 |
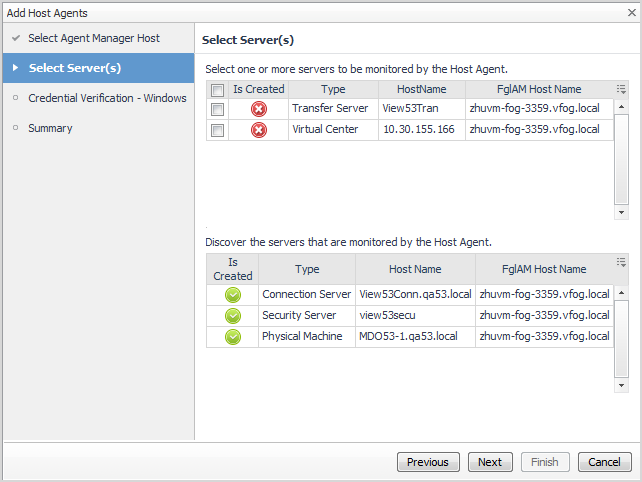
Select those servers for which you want to create an Infrastructure (IC) Agent, then click Next. The agent will monitor the selected servers. |
|
• |
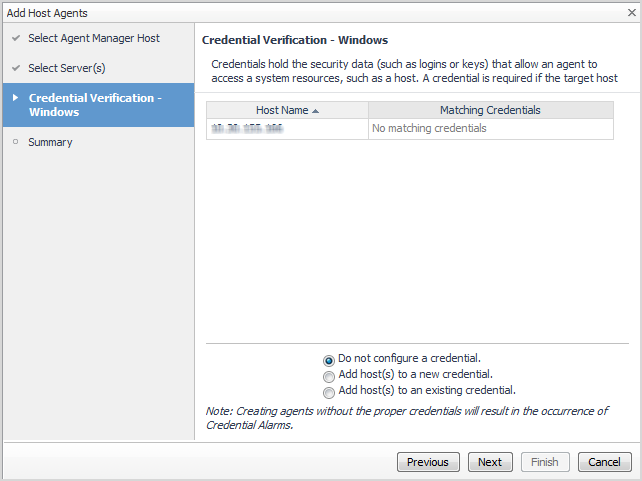
Do not configure a credential. Select this option if you want to configure the credential for this resource at a later time. Local credentials for Windows® and UNIX® are set up by default when Foglight for Infrastructure is installed. Click Next and continue with Step 7. |
|
• |
Add host(s) to a new credential. Select this option if you want to add the host to a new credential. This option is suitable if none of the existing credentials have the connection details needed to access the new host. Click Next and continue with Step 5. |
|
• |
Add host(s) to an existing credential. Select this option if you want to add the host to an existing credential. This option is suitable if an existing credential has the security data needed to access the new host, but you need to edit its resource mappings to include this host. Click Next and continue with Step 6. |
|
a |
On the Credential Type page that appears, select the credential type from the available options. |
|
b |
Click Next. |
|
c |
|
d |
On the Credential Name and Lockbox page, provide a name to identify the credential, and select a lockbox in which you want to keep the credential. A lockbox can be used to group credentials for access and/or security. In smaller Foglight installations, using the default System lockbox should be sufficient. |
|
e |
On the Resource Mapping page, indicate which hosts you want to associate with this credential. You can either select the host that you are about to start monitoring, all monitored hosts, or hosts whose name contains a specific text string. |
|
f |
Optional. On the Policies page, define one or more policies for this credential. A policy defines the number of times a credential can be used, the number of allowed authentication failures, the time range during which the credential is valid, or the length of time the credential data can be cached on the client. For example, you can specify the number of times the credential can be used, or the time period during which it can be used. For complete information about the available credential policies, see the Foglight Administration and Configuration Help. |
|
a |
On the Credential page that appears, select an existing credential to contain this host. |
|
b |
Click Next. |
|
c |
On the Resource Mapping page, indicate which hosts you want to associate with this credential. You can either select the host that you are about to start monitoring, all monitored hosts, or hosts whose name contains a specific text string. |
|
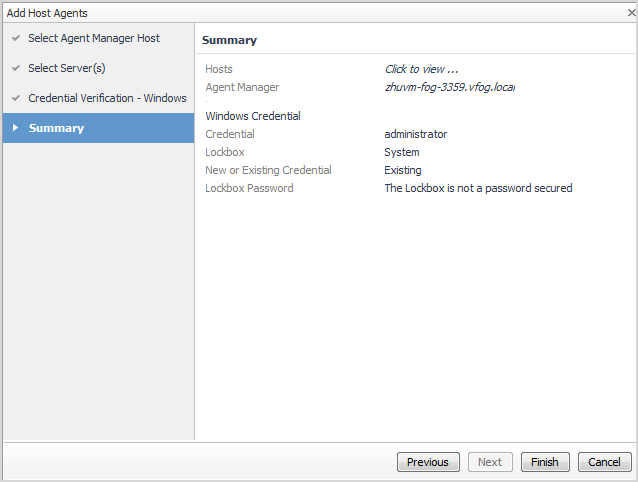
7 |
On the Summary page that appears, review the information provided about the host and the monitoring agent. |
|
8 |
Click Finish. |
|
3 |
For more information, see these topics:
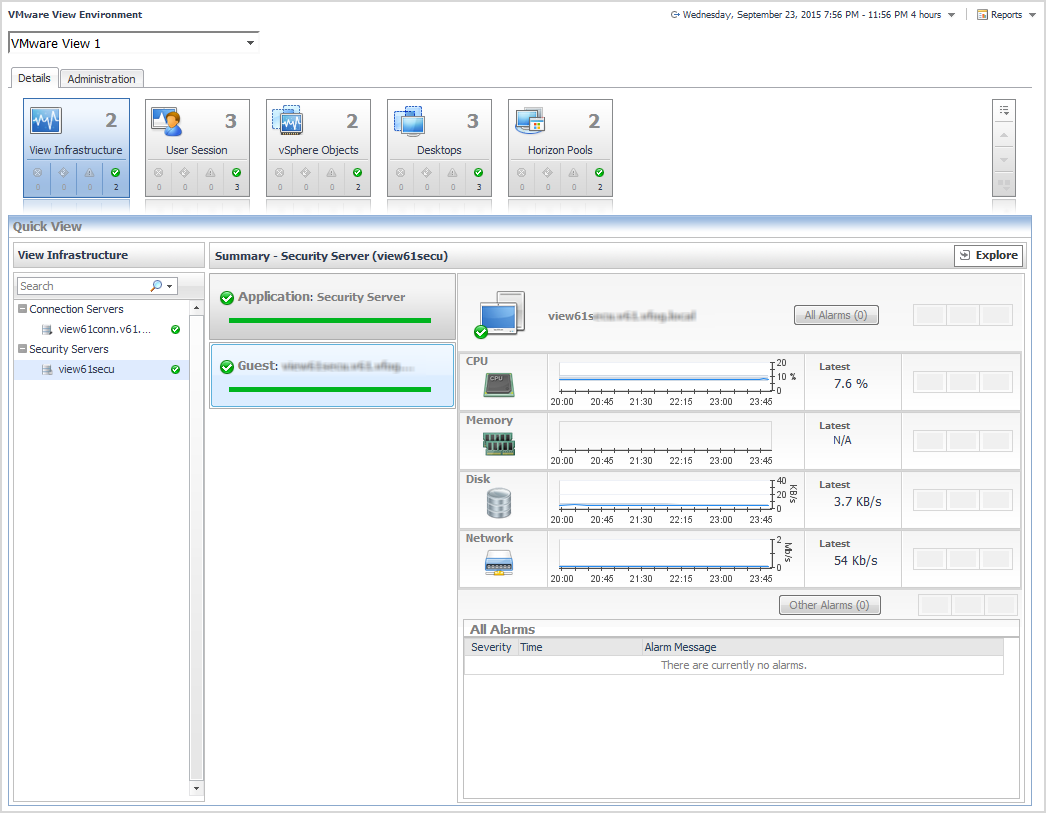
The Details tab contains the Details view and the Quick View. Selecting an object type and its alarm state in the Details view shows the summary information for your selection in the Quick View. For more information about the data appearing on this dashboard, see Explore the VMware View Environment Details tab.
You can use this tab to configure and administer View Connection Server agents to collect data from your monitored environment. For more information, see Explore administrative tasks.