Shares tab
This tab is available in the VMware Explorer. To find it, open the VMware Explorer and on the Virtual Infrastructure view, that appears on the navigation panel, select a cluster, ESX® host, or resource pool instance. In the VMware Explorer, open the Shares tab.
The VMware Explorer’s Shares tab displays the CPU and memory shares that are in use by the virtual machines associated with the selected component.
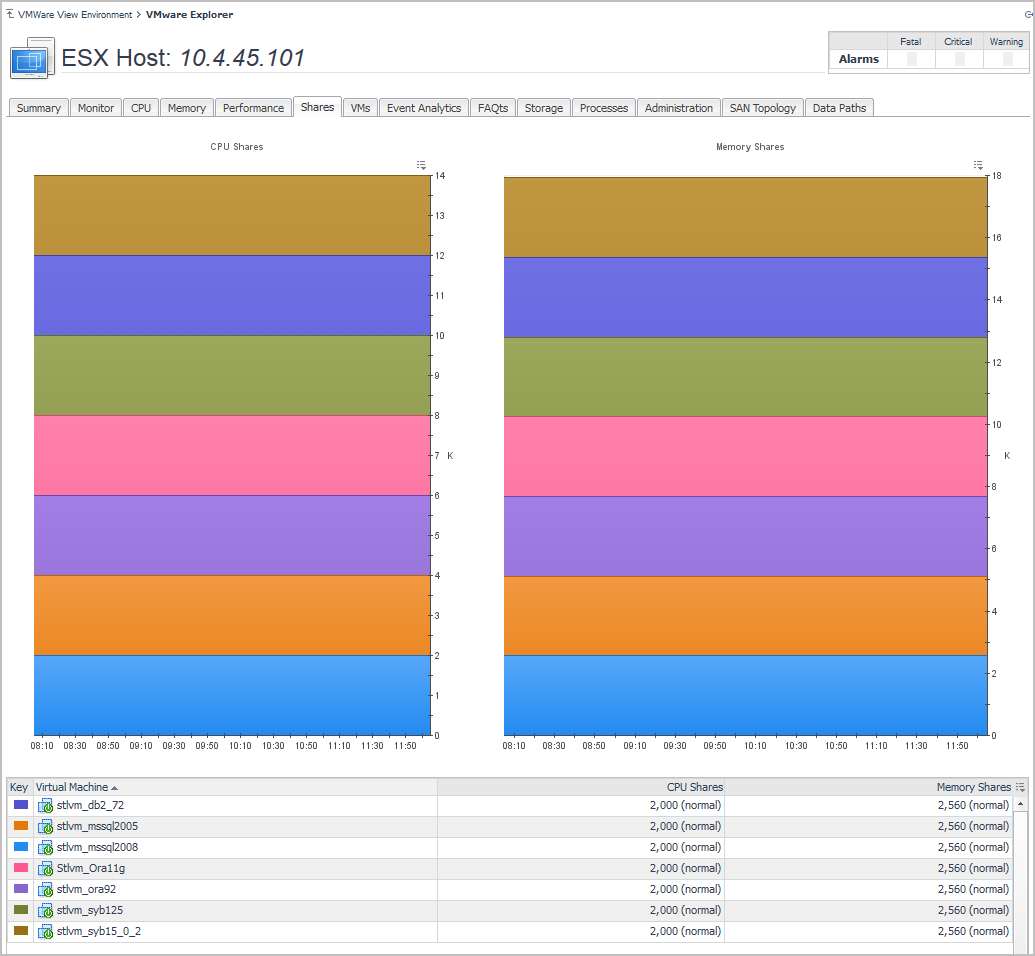
This view is made up of the following embedded views:
This view shows the CPU shares that are in use by the virtual machines associated with the selected cluster, ESX host, or resource pool instance.
This view shows the memory shares that are in use by the virtual machines associated with the selected cluster, ESX host, or resource pool instance.
This view shows a list of all virtual machines that are associated with the selected cluster, ESX host, or resource pool instance. For each virtual machine, it displays its name along with a color indicator for displaying this information in the Active Memory and Shared Memory views. The list also shows the numbers of CPU and memory shares used by each virtual machine.
Storage tab
This tab is available in the VMware Explorer. To find it, open the VMware Explorer and on the Virtual Infrastructure view, that appears on the navigation panel, select a Virtual Center, Datacenter, Cluster, ESX® host, or virtual machine instance. In the VMware Explorer, open the Storage tab.
The VMware Explorer Storage tab displays combination of embedded views organized into physical drive and logical disk sections. It identifies the physical drives with the highest disk activity, and the logical drives with the lowest capacity. It also lists all physical drives for the selected server, their read and write rates, along with the logical drives, the space used on each and shows data growth patterns and the related estimates.
This view is made up of the following embedded views:
This view contains information about the used, free, and total space of the selected components’s datastores, along with projected short-term estimates, given the current growth patterns. It also identifies the datastores that have the lowest percentage of free space. For each identified datastore, it shows the total amount of datastore space, including used and free space, free space, weekly growth rate, the current percentage of the used disk space, and the estimated time after which the datastore will be full.
This view contains information about the used, free, and total space of the selected virtual machine’s logical disks, along with projected short-term estimates, given the current growth patterns. It also identifies the logical disks that have the lowest percentage of free disk space. For each identified disk, it shows the total amount of disk space, including used and free space, free disk space, weekly growth rate, the current percentage of the used disk space, and the estimated time after which the disk will be full.
This view contains information about the read and write activities that take place on the physical drives of the selected component. It identifies the physical drives that have the highest amount of disk activity. For each identified drive, it shows the number of reads and writes, along with their read and write rates. It also contains a list of all physical drives that shows the numbers or read and write requests, and the rate at which the data is read from to or written to the selected drive, all during a selected time period.
Summary tab
The Summary tab is provided as part of the VMware Explorer dashboard Primary view. You can open this tab from the top of the VMware Explorer Primary view. For more information about the VMware Explorer dashboard, see Use the VMware Explorer .
The Summary tab provides a hierarchical inventory, in the form of tiles, of the objects that are related to the object or group of objects selected.
Each tile shows how many of the corresponding object type there are, as well as the count of objects of that type in each of the alarm states (normal, warning, critical, fatal).
More detailed information for the selected object or objects is displayed in the collapsible views below the Summary tab.
On a tile, click the object type icon, the object type name, or the object count, to view a popup that lists all objects of the corresponding type, along with their respective states. Click a column header on the popup to change the sort order. Click an object in the popup list to view details for that object in the VMware Explorer dashboard.
On a tile, click an alarm state icon or the number below it to view a popup that shows the outstanding alarms of that state for the corresponding object type.
If an alarm state has a count of zero, then you can not select that alarm state. When you click a normal state icon or count, the VMware Explorer page is refreshed, but you do not see an alarms popup because there are no alarms associated with the normal state.
Utilizations views
A Utilizations view is provided in the VMware Explorer dashboard. The Utilizations view is part of the VMware Explorer Primary view and is typically located at the center of the Primary view. For more information about the VMware Explorer dashboard, see Use the VMware Explorer .
The Utilizations view provides numerical and graphical representations of utilization metrics associated with the single object (datacenter, cluster, ESX® Server, resource pool, or virtual machine) or collection of objects of a particular type (datacenters, clusters, ESX Servers, resource pools, or virtual machines) that is selected.
The metrics and the amount of detail displayed on the Utilizations view vary depending on the type of object that is being viewed.
A Utilizations view may not appear at all depending on the object or collection of objects selected from the Virtual Infrastructure view and on the navigation tab selected from the VMware Explorer Primary view heading.
Within a single object Utilizations view, you can hover the cursor over any metric to see a description of that metric, and you can click any metric or chart to see a popup with a detailed chart.
Within a collection of objects Utilizations view, you can hover the cursor over any graph to see an exact unit measurement that corresponds to the placement of the cursor, and you can click any metric or chart to see a popup with a detailed chart.
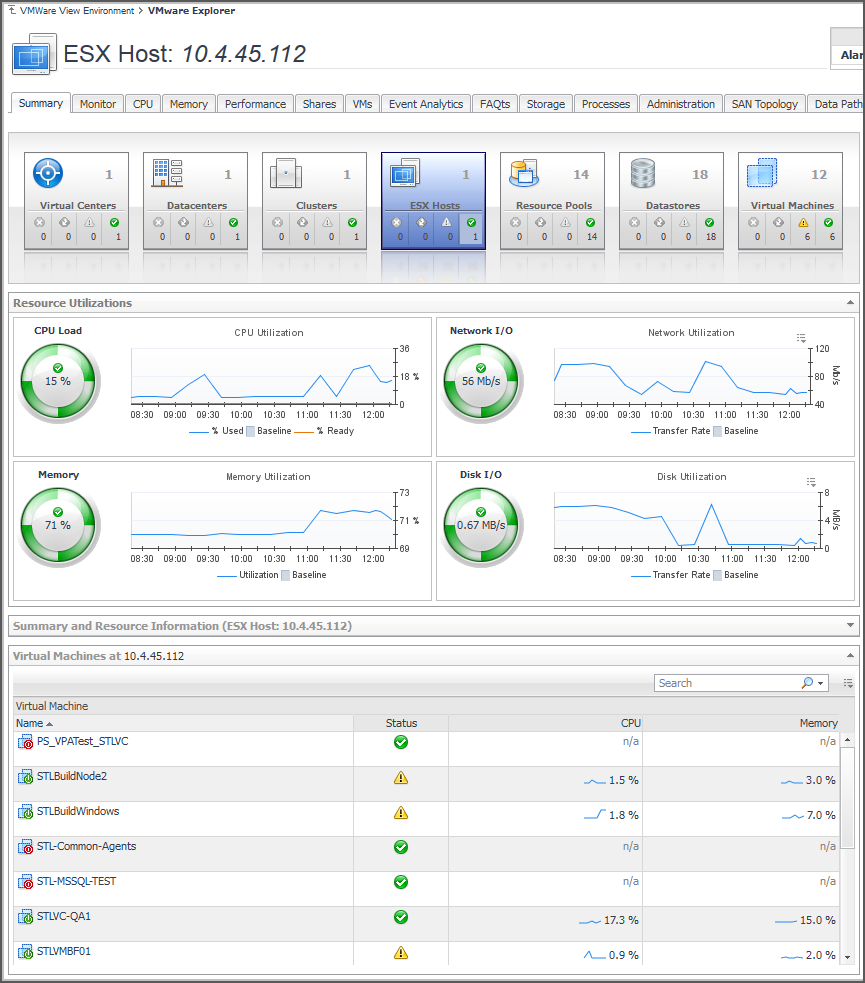
When you select a single object (datacenter, cluster, ESX Server, resource pool, or virtual machine) from the Virtual Infrastructure view, summary information and a Utilizations view is displayed under the Summary tab in the Primary view. Both the metrics and the amount of detail displayed vary depending on the type of object you select.
Under the Summary tab, a typical Utilizations view for an individual object provides detailed information on the four core ESX infrastructure resources: CPU, memory, disk usage, and network usage. Under other navigation tabs, the Utilizations view for an individual object provides different information. For example, under the VMs tab for an ESX Host, the Utilizations view displays a graph illustrating the percent-used and percent-ready CPU utilization for the virtual machines of that ESX Host. Under still other navigation tabs, like the Memory tab for an ESX Host, the Utilizations view is replaced with other pertinent information.
Within a single object Utilizations view, you can hover the cursor over any metric to see a description of that metric, and you can click any metric or chart to see a popup with a detailed chart.
In a Utilizations view that contains alarm severity level details, you can click an alarm status indicator to see the fatal, critical, and warning alarms for the associated object.
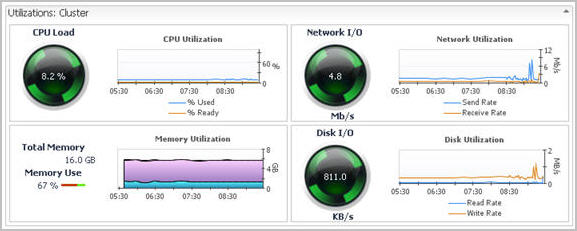
The following image shows a Utilizations view for a cluster object. As explained above, you can hover the cursor over any metric in a Utilizations view to see a description of the metric, and you can click any metric or chart to see a popup with a detailed chart. For example, if you click the CPU Load gauge for a cluster object, a graph of CPU utilization over the time range specified for the VMware Explorer dashboard is displayed. If you click the Memory Utilization graph, a larger view of the graph with descriptive text about each memory metric is displayed.
When a collection of objects of a particular type (datacenters, clusters, ESX Servers, resource pools, or virtual machines) is selected from the Virtual Infrastructure view, summary text and a chart—or other compositional information for the collection—are displayed under the Summary tab in the Primary view. No Utilizations view is displayed.
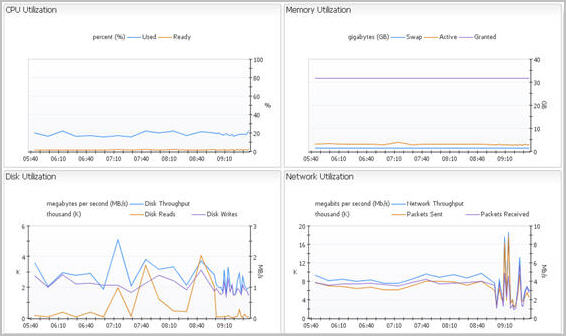
Under some of the other navigation tabs (the Performance and VMs tabs, for examples) in the Primary view, the Utilizations view does appear for collections of objects. Under the Performance tab, the Utilizations view typically displays four graphs showing CPU, memory, disk, and network resource utilizations for the objects in the selected collection. Under the VMs tab, the Utilizations view typically displays a graph illustrating the percent-used and percent-ready CPU utilization for the virtual machines of the selected collection.
Within a collection of objects Utilizations view, you can hover the cursor over any graph to see an exact unit measurement that corresponds to the placement of the cursor, and you can click any metric or chart to see a popup with a detailed chart.
The following image shows a Utilizations view for a collection of ESX Server objects.