Getting Started
Introducing Foglight for Storage Management
Navigating Foglight for Storage Management
Verifying StorageCollector/Generic SMIS Storage Agents are Collecting Storage Data
Understanding Metric Data in Charts and Tables
Modifying and Extending Data Collection
Next Steps
Monitoring Storage Performance
Introducing the Storage Environment Dashboard
Monitoring Your Storage Environment
Investigating Storage Devices
Understanding Status, Alarms, and Rules in Foglight for Storage Management
Reviewing the Status of All Devices
Assessing Storage Alarms
Monitoring Fabrics
Monitoring Storage Arrays
Monitoring Filers
Asking Questions About the Monitored Storage Environment
Assessing Connectivity and I/O Performance
Introducing the Virtualization Dashboards
Summary of Icons Used in Topology Diagrams
Exploring Connectivity with SAN Topology Diagrams
Exploring I/O Performance with SAN Data Paths
Monitoring Storage Capacity
Capacity Trending
Evaluating Pool Capacity
Environment Summary/Monitoring/Summary
Capacity Reports
Low Capacity Rule
Storage Capacity tab
Creating Storage Reports
Introducing the Storage Explorer
Exploring a Fabric
Exploring a Switch
Exploring a Cisco VSAN
Exploring a Filer
Exploring a Storage Array
Investigating Storage Components
Non-Clustered Storage Arrays
Dell EqualLogic Storage Array
EMC VPLEX Storage Array
EMC Isilon Storage Array
Common Data for Filers and Storage Arrays
Introducing Storage Component Dashboards
Investigating an Aggregate
Investigating an Array/Filer Port
Investigating a Controller
Investigating a Directory
Investigating an EqualLogic Member
Investigating an FC Switch Port
Investigating an Isilon Node
Investigating a LUN
Investigating a NASVolume
Investigating a Physical Disk
Investigating a Pool
Investigating VPLEX Storage
Pool belonging to a non-clustered storage array or EqualLogic storage array
Pool belonging to an Isilon storage array
Common Component Disk Tab Data
Introducing VPLEX Virtualization Components Dashboards
Investigating Director - Ports
Investigating a Virtual Volume
Investigating a Storage Volume
Troubleshooting Storage Performance
Starting a Troubleshooting Investigation
Analyzing Storage Issues
Analyzing the Pool
Changing Latency Thresholds
Understanding the Troubleshooting Algorithm
Managing Data Collection, Rules, and Alarms
Collecting Virtual Storage-to-SAN Relationships
Inferring Physical-Host-to-Storage Relationships
Understanding Metrics
Enabling Dependency Processing
Reviewing and Editing Host-Port Assignments
Running Dependency Processing Manually
Customizing Helper Strings for Dependency Processing
Reviewing Inferred Hosts
Modifying Data Collection Schedules
Understanding Data Collection Types and Schedules
Modifying Data Collection Schedules for Storage Collector Agents
Managing Foglight for Storage Management Rules
Managing Alarm Settings
Troubleshooting Database Limits
Units of Measurement
Performance Metrics
Online-Only Topics
Fabrics and FC Switches — Performance Metrics
Storage Arrays and Filers — Disk I/O Performance Metrics
Clustered Storage Arrays — Network Performance Metrics
Capacity Metrics
Storage Arrays — Array, Member, and Pool Capacity Metrics
Filers — Filer and Aggregate Capacity Metrics
Storage Arrays and Filers — LUN, NASVolume, and Disk Capacity Metrics
Overview of Metrics in Foglight for Storage Management
Investigating a Virtual Volume
|
1 |
On the navigation panel, under Dashboards, click Storage & SAN > Storage Explorer. |
|
2 |
|
3 |
In the Summary tab, review performance in terms of key metrics. |
|
• |
Details. Displays the Virtual Volumes’s status, physical details, parent device and capacity metrics. |
|
• |
Data Rate Chart. Shows the history Data Rate of the virtual volume. |
|
• |
Latency Chart. Shows the history Latency of the virtual volume.Alarm Summary. Displays alarms on the VPLEX array. |
|
• |
Alarm Summary. Displays alarms on the selected virtual volume. To investigate further, click an alarm. See Assessing Storage Alarms. |
|
4 |
In the Frontend Topology tab, displays the dependency mapping from virtual machines to the virtual volume. Click a cloud node to display the network dependency mapping from VM disks to the virtual volume. |
|
5 |
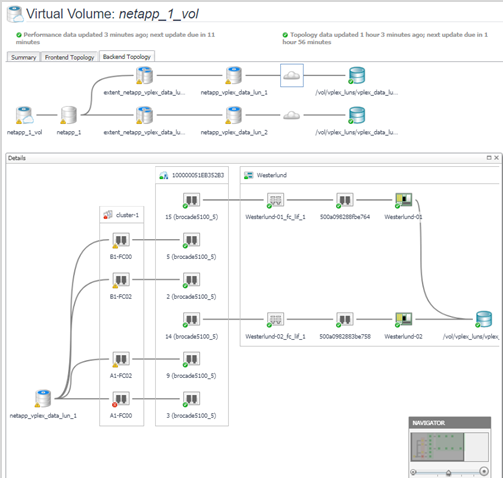
In the Backend Topology tab, displays the dependency mapping from the virtual volume to the destination LUNs. Click a cloud node to display the network dependency mapping from the virtual volume to the destination LUNs. |
Investigating a Storage Volume
|
1 |
On the navigation panel, under Dashboards, click Storage & SAN > Storage Explorer. |
|
2 |
|
3 |
In the Summary tab, review performance in terms of key metrics. |
|
• |
Details. Displays the storage volume’s status, physical details, parent device, and size if available. |
|
• |
|
• |
Alarm Summary. Displays alarms on the selected storage volume. To investigate further, click an alarm. See Assessing Storage Alarms. |
|
4 |
In the Topology tab, displays the dependency mapping from virtual volumes to the storage volume, and the dependency mapping from the storage volume to destination LUNs. Click a cloud node to display the network dependency mapping from the storage volume to destination LUNs. |
Troubleshooting Storage Performance
This section describes the following topics:
Starting a Troubleshooting Investigation
|
1 |
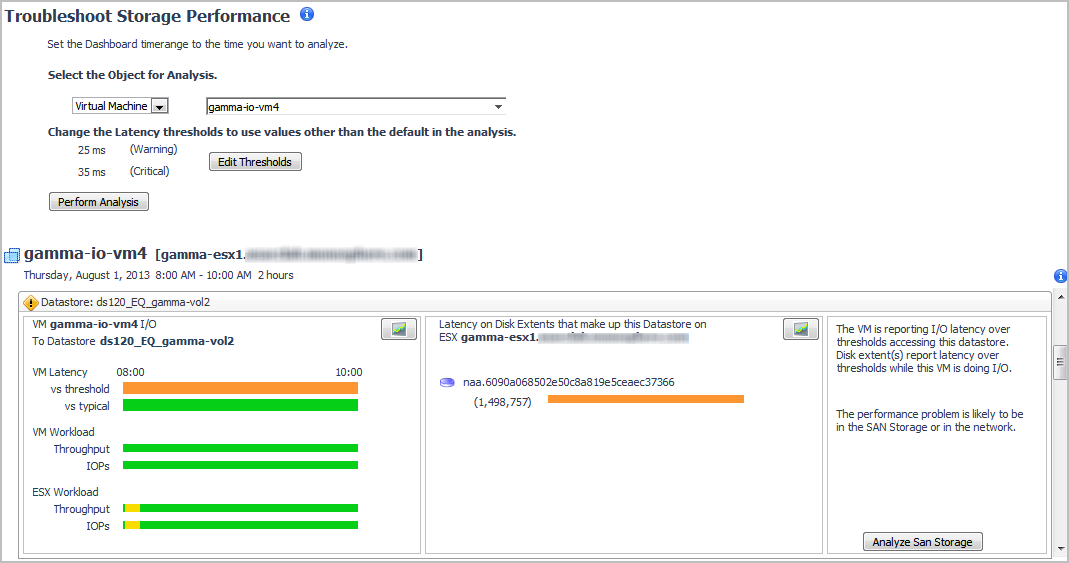
On the navigation panel, under Dashboards, click the Insights tab, and then click Live Troubleshooter. |
|
4 |
|
5 |
Click Perform Analysis. |
|
• |
If a Normal |
|
• |
If the Attention |


