立即与支持人员聊天
与支持团队交流

Foglight for Hyper-V 6.0.0 - User Guide

About Hyper-V Monitoring in Foglight Evolve Cloud Agent administration Performance monitoring with the Hyper-V Environment dashboard Performance investigation with the Hyper-V Explorer Hyper-V Monitoring in Foglight Evolve Cloud alarms Appendix: Hyper-V Agent error codes

Storage view

The Storage view is a tree view. It lists the server volumes and cluster volumes existing in your environment, and shows their severity state.

This view appears in the Quick-View on the left when you select the Storage tile in the Virtual Environment view.
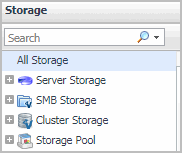
Figure 118. Storage view

Selecting the All Storage node displays the overall resource utilization for all volumes in your integrated system and identifies the ones that consume the highest amount of system resources in the Summary - All Storage view on the right. Similarly, selecting a storage node shows storage-specific metrics in the Volume Summary view.

Alarm severity. The state of the most recent alarm raised against the volume.
All Storage. A parent node for the instances of all volumes that appear in this view.
Server Storage. The parent node for the instances of all server storage.
SMB Storage. The parent node for the instances of all SMB storage.
Cluster Storage. The parent node for the instances of all cluster storage.
Storage Pool. The parent node for the instances of all storage pools.

Drill down on:

Summary - All Storage view

The Summary - All Storage view displays overall resource utilization information for all volumes in the selected service and identifies the elements that consume the highest amount of resources.

This view appears in the Quick-View on the left when you select All Storage in the Storage view.
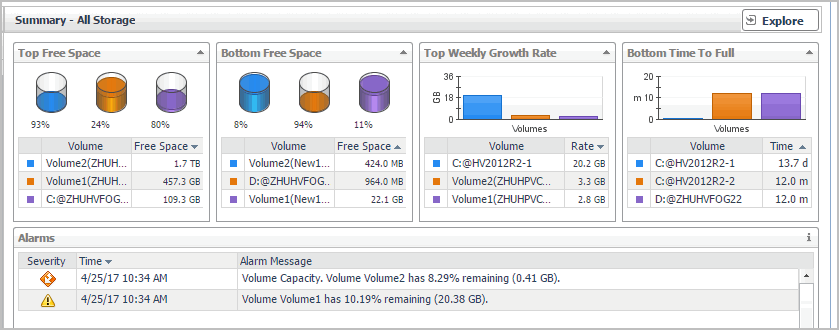
Figure 119. Summary - All Storage view

This view is made up of the following embedded views:

Table 68. Alarms

Lists the alarms generated against the monitored volumes.

Alarm Message. An explanation about why the alarm occurred.
Severity. Indicates the alarm severity: Warning, Critical, or Fatal.
Time. The time at which the alarm was generated.

Drill down on:

Alarm Message, Severity, or Time. Displays the Alarm dialog box, showing additional information about the alarm. For more information about alarms in Foglight Evolve Cloud, see the Foglight Evolve Cloud User Help.

Identifies the volumes with the smallest amounts of free space during the selected time range.

Volume. The name of the volume identified amongst those with the lowest amount of free space.
Free space. The amount of available space on the volume.

Drill down on:

Volume. Shows the Volume view.

Identifies the volumes that are most likely to become full during the selected time range.

Volume. The name of the volume identified as being likely to become full.
Rate. The projected amount of time after which the volume becomes full.

Drill down on:

Volume. Shows the Volume view.
Table 71. Top Free Space

Identifies the volumes with the highest amounts of free space during the selected time range.

Volume. The name of the volume identified as having a high amount of free space.
Free space. The amount of space available on the volume.

Drill down on:

Volume. Shows the Volume view.


Identifies the volumes with the highest growth rate of used disk space on a weekly basis.

Volume. The name of the volume identified as having high weekly growth rate.
Rate. The rate at which the associated virtual machines use the disk space.

Drill down on:

Volume. Shows the Volume view.

Volumes Summary view

The Volumes Summary view displays complete details for all volumes in the selected service and identifies the ones that consume the lowest amounts of disk resources.

This view appears in the display area when you click Explore in the Summary - All Storage view.
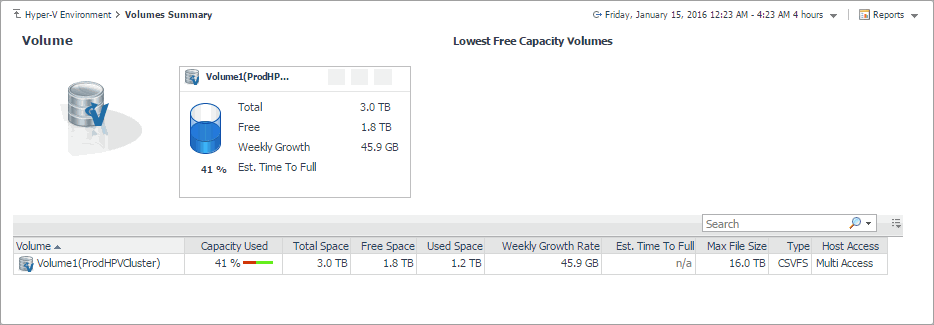
Figure 120. Volumes Summary view

This view is made up of the following embedded views:

Table 73. Volume table

Lists all volumes that are available in the selected service.

Capacity Used. The percentage of the volume space that is currently in use.
Est. Time Until Full. The estimated amount of time after which the selected volume becomes full.
Free Space. The amount of volume space that is available for use.
Host Access. Indicates if multiple servers can access to this host.
Max File Size. The maximum file size on the selected volume.
Total Space. The total amount of volume space, including free and used space.
Type. The file system on the selected volume.
URL. The URL to the selected volume.
Used Space. The amount of volume space that is currently in use.
Volume. The name of the volume identified amongst those with the lowest amount of free space.
Weekly Growth Rate. The projected amount of the volume space that becomes in use on a weekly basis.

Drill down on:

Any column. Shows the volume details in the Volume view.
Table 74. Volume tile

For each volume identified amongst those with lowest capacity, this tile provides some basic resource usage indicators.

Free. The amount of volume space that is available for use.
Percent Free. The percentage of volume space that is available for use.
Total. The total amount of volume space, including free and used space.
Volume. The name of the volume, followed by the related alarm counts.
Weekly Growth Rate. The projected amount of the volume space that becomes in use on a weekly basis.

Volume Summary view

The Volume Summary view shows the levels of resource utilization and consumption for a selected volume.

This view appears in the display area when you select a volume in the Summary - All Storage view.
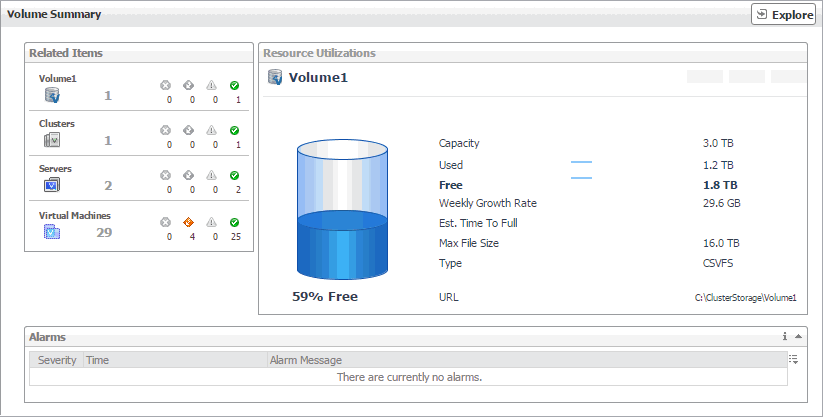
This view is made up of the following embedded views:

Table 75. Alarms

Lists the alarms generated against the selected datastore.

Alarm Message. An explanation about why the alarm occurred.
Severity. Indicates the alarm severity: Warning, Critical, or Fatal.
Time. The time at which the alarm was generated.

Drill down on:

Alarm Message, Severity, or Time. Displays the Alarm dialog box, showing additional information about the alarm. For more information about alarms in Foglight Evolve Cloud, see the Foglight Evolve Cloud User Help.
Figure 122. Alarm dialog box
Table 76. Related Items

Shows the selected volume and other components associated with it in your virtual infrastructure.

Clusters. The number of clusters associated with the selected volume, followed by the related alarm counts.
Servers. The number of servers associated with the selected volume, followed by the related alarm counts.
Virtual Machines. The number of virtual machines that are associated with the selected volume, followed by the related alarm counts.
Volume. Represents the selected volume. Shows the counts of the alarms generated against the volume.

Drill down on:

Clusters. Displays the Clusters dwell, showing the names and states of all clusters that are associated with the selected volume.
Figure 123. Clusters dwell
Server. Displays the Servers dwell, showing the names and state of the servers associated with the selected volume.
Figure 124. Servers dwell
Virtual Machines. Displays the Virtual Machines dwell, showing the names and states of all virtual machines that are associated with the selected volume.
Figure 125. Virtual Machines dwell
Volume. Displays the Other Items Inventory dwell, showing the state of the selected volume.

Shows the resource consumption for the selected volume.

Capacity. The total amount of volume space, including free and used space.
Est. Time Until Full. The estimated amount of time after which the selected volume becomes full.
Free. The amount of volume space that is available for use.
Max File Size. The maximum file size on the selected volume.
Percent Free. The percentage of volume space on the that is available for use.
Type. The file system on the selected volume.
URL. The URL to the selected volume.
Used. The amount of volume space that is currently in use.
Volume. The name of the selected volume, followed by the related alarm counts.
Weekly Growth Rate. The projected amount of the volume space that becomes in use on a weekly basis.

Drill down on:

Free or Used. Displays the Logical Drive Utilization dialog box.
Figure 127. Logical Drive Utilization dialog box
Percent Free. Displays the Storage Used dialog box.
Figure 128. Storage Used dialog box
相关文档

The document was helpful.

选择评级

I easily found the information I needed.

选择评级