立即与支持人员聊天
与支持团队交流

Foglight for Hyper-V 5.7.7 - User and Reference Guide

About Foglight for Hyper-V Agent administration Performance monitoring with the Hyper-V Environment dashboard Performance investigation with the Hyper-V Explorer Foglight for Hyper-V alarms Appendix: Hyper-V Agent error codes

Virtual Environment view

This view appears in the upper part of the Monitoring tab, just above the Quick-View. It displays a high-level overview of the selected virtual environment. The view has a tile for each type of object in your virtual infrastructure: Clusters, Servers, SCVMM Servers, SOFS Servers, Virtual Machines, Storage, and Virtual Switches.

Each tile shows how many of the corresponding object instances there are in your virtual infrastructure, as well as the count of objects of that type in each of the alarm states (Normal, Warning, Critical, Fatal). For example, the following image shows four physical servers: none in the Fatal, Critical or Warning states, and four in the Normal state.

You can move the tiles by dragging and dropping until you achieve the desired layout.

Clicking the object type icon, the object type name, or the object count, shows summary information for that object type in the Quick-View. Clicking an alarm state (for example, Warning) on a tile displays summary information in the Quick-View for the objects of that type that are in the selected alarm state. If an alarm state has a count of zero, then you can not drill down on the alarm state.

This view contains the following tiles:

Table 3. Clusters

Shows the number of clusters in your environment and total alarm counts associated with those clusters.

Alarm counts. The total counts of alarms associated with the clusters, broken down by alarm types (Normal, Warning, Critical, Fatal).
Cluster count. The number of clusters in your environment.

Drill down on:

Alarm counts. Lists the clusters associated with the alarms in the Clusters view, appearing in the Quick-View.
Clusters. Displays cluster-related combination of views in the Quick-View.
Table 4. Servers

Shows the number of servers in your environment and total alarm counts associated with those servers.

Alarm counts. The total counts of alarms associated with the physical servers, broken down by alarm types (Normal, Warning, Critical, Fatal).
Server count. The number of physical servers in your virtual environment.

Drill down on:

Alarm counts. Lists the servers associated with the alarms in the Servers view, appearing in the Quick-View.
Servers. Displays servers-related combination of views in the Quick-View.
Table 5. SCVMM Servers

Shows the number of SCVMM servers in your environment and total alarm counts associated with those servers.

Alarm counts. The total counts of alarms associated with the SCVMM servers, broken down by alarm types (Normal, Warning, Critical, Fatal).
Server count. The number of SCVMM servers in your virtual environment.

Drill down on:

Alarm counts. Lists the SCVMM servers associated with the alarms in the SCVMM Servers view, appearing in the Quick-View.
Servers. Displays SCVMM server-related combination of views in the Quick-View.

Shows the number of virtual machines in your environment and a list of virtual machines with worst performance score.

VM Count by Alarm Severity. The total counts of alarms associated with the virtual machines, broken down by alarm types (Normal, Warning, Critical, Fatal).
VM Count by Status. The number of VMs associated with the virtual machines, broken down by VM status (Power On, Power Off, Paused, Saved, Unknown).
VM Count by Top 5 Alarms. The number of VMs that have top 5 alarms.
VM Performance Score - Worst 16 VMs. The list of VMs which have the worst performance score.

Drill down on:

VM Count by Alarm Severity. Lists the virtual machines associated with the alarms in the Virtual Machines view, appearing in the Quick-View.
VM Count by Status. Displays virtual machines views in the Quick-View.
VM Count by Top 5 Alarms. Displays the alarms in the Alarms view, appearing in the Quick-View.
Table 7. Storage

Shows the number of virtual volumes in your environment and total alarm counts associated with them.

Alarm counts. The total counts of alarms associated with the virtual volumes, broken down by alarm types (Normal, Warning, Critical, Fatal).
Server count. The number of virtual volumes in your environment.

Drill down on:

Alarm counts. Lists the virtual volumes associated with the alarms in the Storage view, appearing in the Quick-View.
Virtual Machines. Displays virtual volume views in the Quick-View.

Shows the number of virtual switches in your environment and total alarm counts associated with them.

Alarm counts. The total counts of alarms associated with the virtual switch, broken down by alarm types (Normal, Warning, Critical, Fatal).
Server count. The number of virtual switches in your environment.

Drill down on:

Alarm counts. Lists the virtual switches associated with the alarms in the Virtual Switches view, appearing in the Quick-View.
Virtual Machines. Displays virtual switch views in the Quick-View.


Table 9. SOFS Servers

Shows the number of Scale-Out File Server (SOFS) in your environment and total alarm counts associated with them.

Alarm counts. The total counts of alarms associated with the SOFS servers, broken down by alarm types (Normal, Warning, Critical, Fatal).
Server count. The number of SOFS servers in your environment.

Drill down on:

Alarm counts. Lists the SOFS servers associated with the alarms in the SOFS Servers view, appearing in the Quick-View.
Servers. Displays servers-related combination of views in the Quick-View.

Quick-View

The Quick-View is a container view. It contains a combination of server or virtual machine views, depending on your selection in the pane on the left. It appears in the lower part of the Hyper-V Environment dashboard, just below the Virtual Environment view.
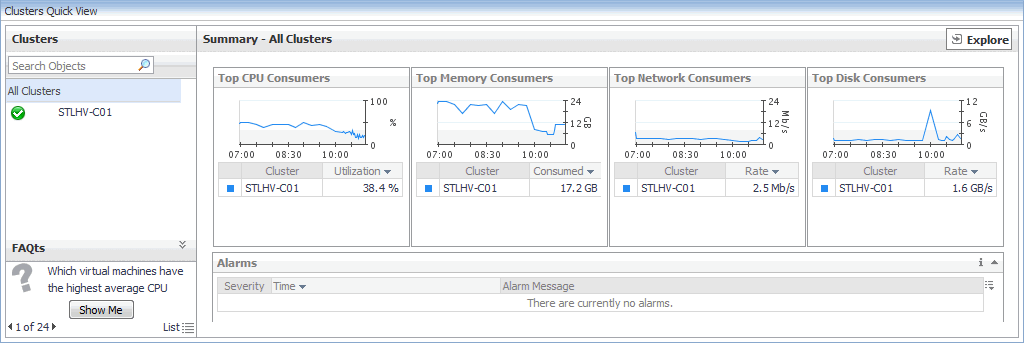
Figure 14. Quick-View

Alarms view

This view displays a list of alarms generated against the objects or group of objects selected in the Quick-View. Use this view to quickly identify any potential problems related to a specific object.

Figure 15. Alarms view


Alarm Message. An explanation about why the alarm occurred.
Severity. The alarm severity icon: Warning, Critical, or Fatal.
Time. The time when the alarm was generated.

Drill down on:

Alarm Message, Severity, or Time. Displays the Alarm dialog box, showing additional information about the alarm. For more information about alarms in Foglight, see the Foglight User Help.

Cluster monitoring

A cluster object is a group of Hyper-V servers that share common storage resources and network configurations.

To review data collected about a specific cluster or all clusters, make your selection in the Quick-View.

相关文档

The document was helpful.

选择评级

I easily found the information I needed.

选择评级