Online-Only Topics
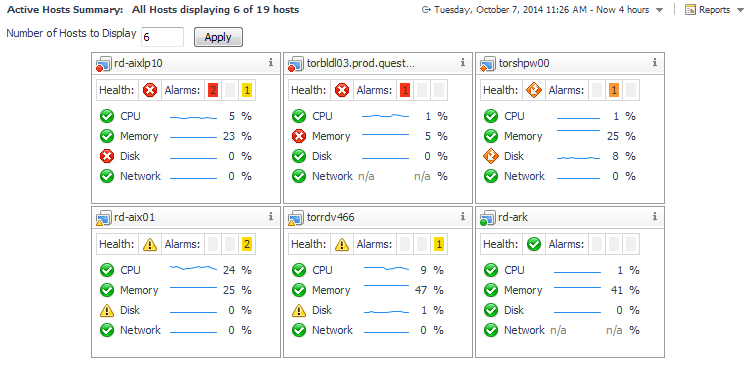
If you have a large number of hosts, you can use the Hosts dashboard, or use the Active Hosts Summary dashboard as a portlet in a custom dashboard and configure custom dashboards for each set of hosts. For information about creating custom dashboards using a selected dashboard, see Creating a Custom Dashboard Based on the Current Dashboard on page 82.
|
• |
|
1 |
On the Action panel, open the General tab, click Service Selector. |
|
2 |
Click the Filter Hosts By Service check box. |
Online-Only Topics
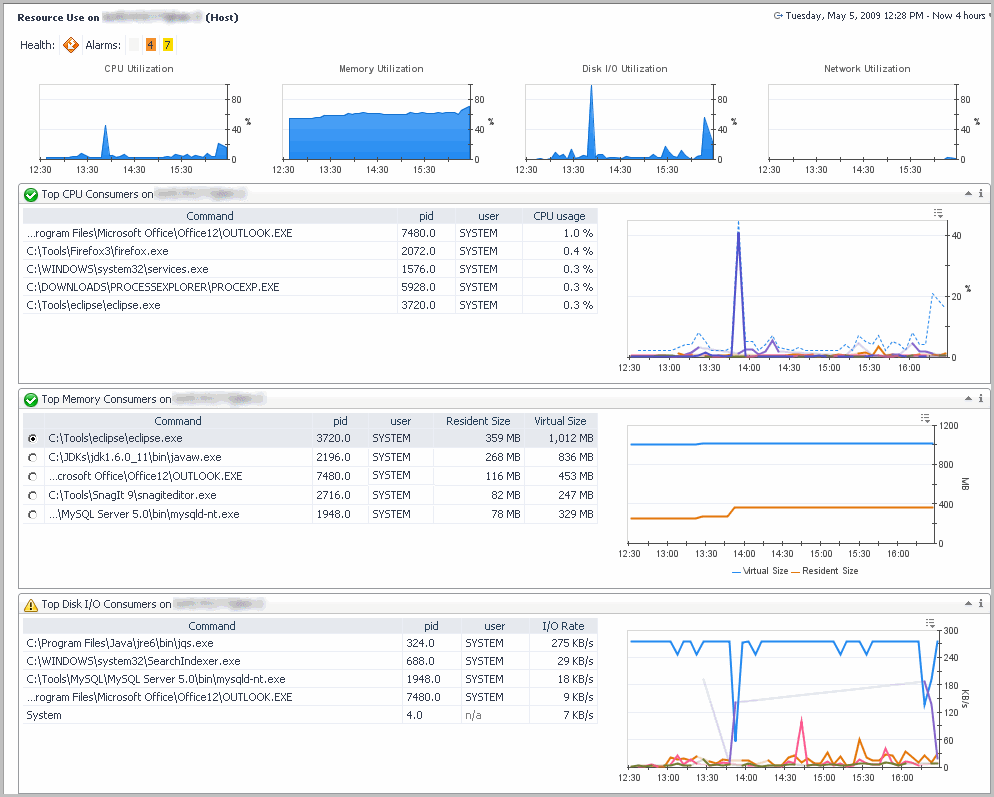
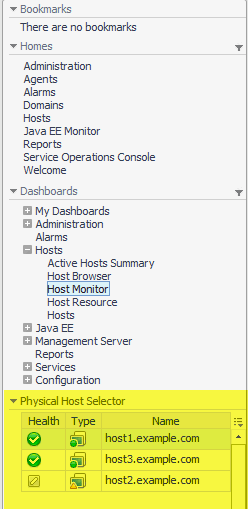
The name of the current host is at the top-left of the dashboard. To see data for another physical host, click Physical Host Selector in the action panel to open the Physical Host Selector dialog box, where you can choose another host.
Online-Only Topics
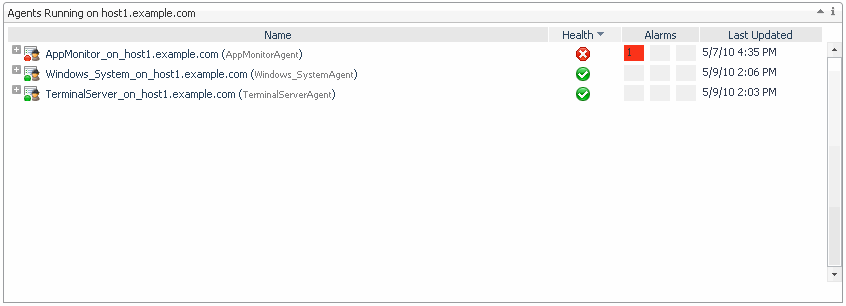
The Host Browser dashboard is similar to the Agents browser, except that it shows the agents for only one host at a time. It contains two views: Agents Running on <host> and Outstanding Alarm(s) for <host>.
The name of the current host is at the top-left of the dashboard. To see data for another physical host, click Physical Host Selector in the action panel to open the Physical Host Selector dialog, where you can choose another host.
The Outstanding Alarms view displayed at the bottom half of the dashboard is a common view in Quest Foglight. For information about working with alarms, see Viewing, Acknowledging, and Clearing Alarms.
Online-Only Topics
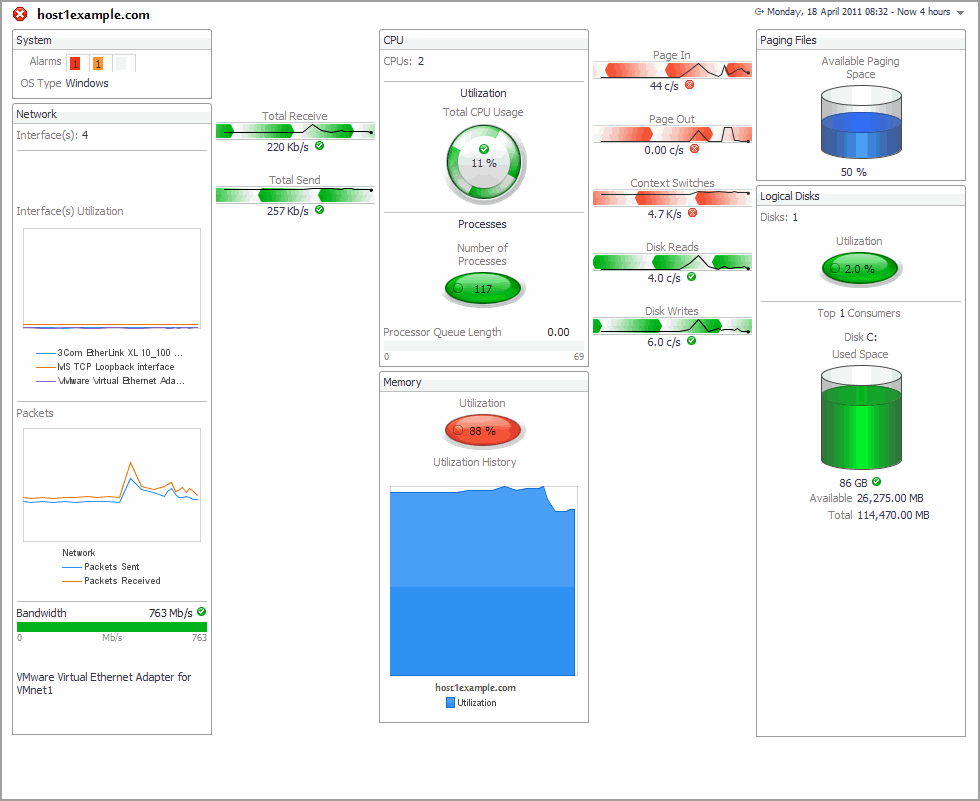
The Host Monitor dashboard displays detailed information about a monitored host. You access this dashboard from the navigation panel, under Dashboards > Hosts > Host Monitor.
To view the property details for another host running in your environment, open the navigation panel, and select a host from the Physical Host Selector.

