立即与支持人员聊天
与支持团队交流

Foglight for DB2 (Cartridge) 5.7.5.50 - User Guide

Introduction to Foglight for DB2 LUW Using Foglight for DB2 LUW Reference
Dashboards and Views Collections and Metrics
CF Locks Collection CF Memory Pools Collection CF Resource Usage Collection Current Agents Details Collection Agents Summary Collection Current Locks Wait Collection Database Bufferpools Summary PS Collection Database Configuration Collection Database Tablespaces Collection Database Tablespaces Summary Collection Database Usability Collection Database Parameters Collection Database Instance Parameters Collection Database Instance Registry Variables Collection Database Tablespaces BP Collection FCM Activity Collection FS DB Storage Collection FS DB Storage Summary Collection FS Instance Storage Collection FS Storage Collection FS Storage Summary Collection General Activity Collection HADR Activity Collection Host Properties Collection OS General Collection Instance Activity Collection Instance General Collection Instance Nodes Collection Instance Usability Collection IO Activity Collection License Details Collection Log Activity Collection Log File Collection Log Message Collection Messages Count Collection Monitor Switches Collection OS DB2 General Process Collection Partition Tablespaces Summary Collection Partition Usability Collection pureScale Alerts Collection Top SQLs Collection Top SQLs Full Text Collection Top SQLs Text Collection Query Agents Details Collection Database Partition Activity Collection DB2 Partition Subcategories Wait Collection History Locks Wait Collection History Locks Summary Collection Instance Memory Collection Instance Memory Pool Collection Instance Memory Summary Collection Instance Memory Total Collection Database Memory Collection Database Memory Pool Collection Database Memory Pool DB Collection Database Memory Summary Collection Database Memory Total Collection Database Buffer Pools Collection Database Tables Collection Database Partition Backup Collection Database Tables Global Collection Database Applications Collection

Database Cue Card

The Database Cue Card displays details about a database instance selected in the Databases Instances View.


Alarms, . The number of Critical alarms associated with the selected database instance.
Alarms, . The number of Warning alarms associated with the selected database instance.
Alarms, . The numbers of Fatal alarms associated with the selected database instance.
General, DB type. Specifies the type of the monitored database instance: DB2.
General, Version. Version number of the DB2 database.
General, Up since. How long the instance has been up and running.
Configuration, Status. If the instance is configured or not.
Configuration, Licensed. If the instance is licensed or not.
Configuration, Members. Number of members in the instance.
Configuration, Databases. Number of databases in the instance.
Configuration, OS type. Operating system type.
Performance, Availability. Availability of the instance in percent.
Performance, Local connections. Number of local connections.
Performance, Remote connections. Number of remote connections.
Instance Utilization, DB2 CPU(%). Percentage of the CPU used by DB2.
Instance Utilization, Memory (%). Percentage of the memory used by DB2.
Storage, Fixed Size. The total and free amount of fixed storage in MB.
Storage, Auto Storage. The total and free amount of auto storage in MB.
Average Active Sessions. The average number of active sessions compared to the time of those sessions.

Clicking the Overview icon in the lower right corner takes you to the Instance home page.

Instance home page

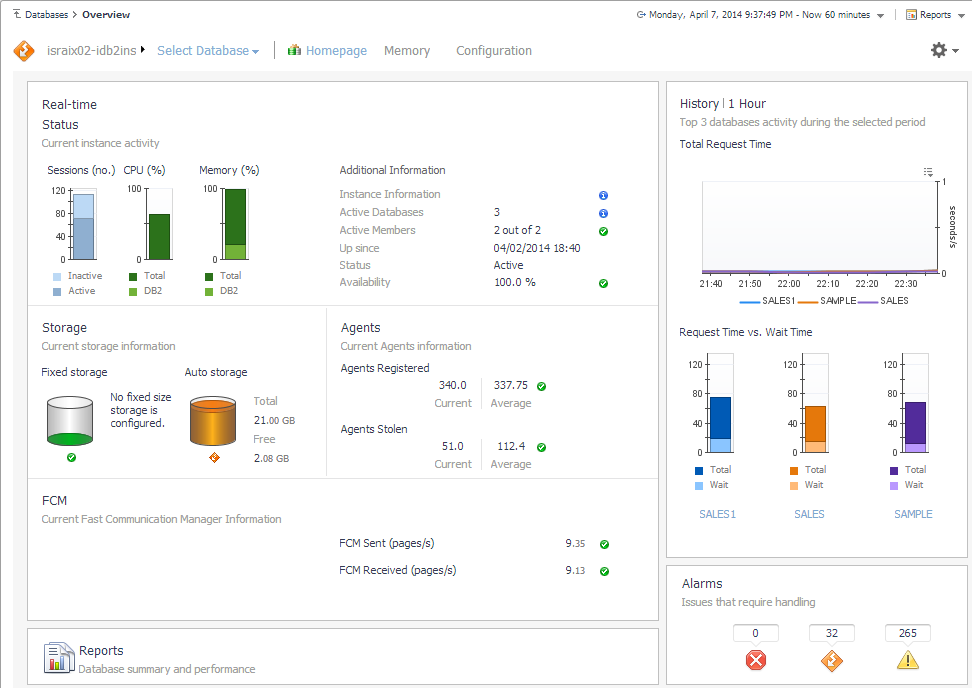
The Instance home page provides metrics on the overall status of the selected instance.
How to Get Here

To open the Instance home page, from the Databases dashboard, find the instance you want to explore and click the instance name (or click and select Overview). The Databases > Overview dashboard opens with a summary of the selected instance.

From here, you can drill down to metrics on memory allocation and perform configuration tasks.

The following summary and drill-downs pages are provided:

Configuration Drill-down (links to description under Database home page)

Summary

By default, the Summary page view is displayed on the Instance home page. The Summary page contains the following embedded panes:

The Status pane displays metrics that provide an overview of the current state of the DB2 instance. It is at the top of the Instance home page.

Sessions (no.). The total number of active and inactive sessions within the instance.


CPU (%). Total is the average CPU usage of all the underlying hosts on which the instance resides. DB2 is the total CPU usage by all DB2 processes running on the host.


Memory (%). Total is the average memory usage of all the underlying hosts on which the instance resides. DB2 is the total memory usage by all DB2 processes running on the host.


Instance Information. The configuration information for the instance (including the product version and whether the product is licensed). Click the icon for the configuration information.


Active Databases. The total number of local databases within the instance that have applications connected.


Active Members. The total number of active members within the instance.


Up since. The date and time the instance was started.


Status. Whether the instance is active.


Availability. The current availability of the instance.


pureScale only Active Members. Number of nodes in the pureScale environment.


pureScale only Active CF. Displays information about configured CF nodes and their states.


pureScale only PureScale Alerts. Total number of alerts DB2 reported on the pureScale environment.

The Storage pane provides current storage information for the entire instance. It is at the left of the Instance home page.


Fixed storage. The total disk space that is available for use by fixed-size tablespaces and the disk space that is still free to be used by fixed-size tablespaces.


Auto storage. The total file system space that is available for the instance to use to carry out auto storage tablespace operations. Also, the file system space that is still free for the instance to use to carry out auto storage tablespace operations.

Clicking the icon below either of the charts displays a pop-up that provides additional, related information.

The Agents pane provides registered and stolen agents information for the entire instance. It is located in the middle of the Instance home page.


Agents Registered. Displays the current agents registered to the instance, and the average agents registered to the instance over the course of the selected time range.


Agents Stolen. Displays the current agents stolen from the instance, and the average agents stolen from the instance over the course of the selected time range.

Clicking the icon next to either of the metrics displays a pop-up that provides additional, related information.

The FCM pane displays FCM metrics for a partitioned instance. It is at the left and in the middle of the Instance home page.


FCM Sent (page/s). The total number of FCM buffer pages sent from the current node to the remote node, over the course of the selected time range.


FCM Received (page/s). The total number of FCM buffer pages received by the current node from the remote node, over the course of the selected time range.

Clicking the icon next to either of the metrics displays a pop-up that provides additional, related information.

When an instance is hosted in a DB2 pureScale environment, you can click the PureScale CF link to see metrics about the cluster cache facility (CF).

Current Primary ID. The ID of the CF component.


CPU Usage. Percentage of overall CPU usage on the CF machine.


Current Host. The current host of the selected DB2 instance. In a pureScale environment, the host can change depending on load.


Memory Utilization. Percentage of overall memory usage on the CF component.

Clicking the icon next to either of the metrics displays a pop-up that provides additional, related information.

The Reports pane provides access to the Executive Workload Summary Report, which is a workload overview of the instance and of each database. It is at the bottom left of the Instance home page.

Click the Executive Summary Report link to access the report.

The History pane displays the instance activity over the course of the selected time range. It is at the upper right of the Instance home page.

Top Database Workload. The top three (if available) database workloads, over the course of the selected time range.


Top Database Request Time. The top three (if available) database total request times and wait request times, over the course of the selected time range.

The Alarms pane displays the total number of fatal, critical, and warning alarms that are currently outstanding against the instance. It is at the lower right of the Instance home page.

Data displayed

Fatal. The total number of fatal alarms that are currently outstanding against the instance.


Critical. The total number of critical alarms that are currently outstanding against the instance.


Warning. The total number of warning alarms that are currently outstanding against the instance.

Clicking either of the three numbers opens the Outstanding Alarm(s) dialog box, which provides a list of the outstanding alarms and a brief description of each.

Clicking any of the rows in the Outstanding Alarm dialog box opens the Alarm dialog box, which provides detailed information about the associated alarm.

相关文档

The document was helpful.

选择评级

I easily found the information I needed.

选择评级