|
NOTE: This guide focuses on the real user experience and web request monitoring features included in Foglight APM. If you want to know more about Java™ and .NET® monitoring functionality, see the Foglight for Application Operations User and Reference Guide. |
|
• |
Application Support — responsible for ensuring that application services are performing as expected. Identifies and triages service degradations or outages. |
|
• |
Platform Specialist or Administrator — responsible for the operation of an individual application component (for example, a database, a host, an application server, or a web server). Receives and responds to Foglight alarms on their platform or domain. |
|
• |
Application Architect — a senior escalation resource who is typically engaged by Application Support for assistance in locating the source of an application issue. |
|
• |
Application Developer — responsible for the application code. Uses the Foglight transactional performance dashboards to gain an understanding of the operational execution and performance of their code. |
|
• |
Application Performance Manager — designs and executes the APM strategy. Decides which of the organization’s web sites and web applications to monitor. |
|
• |
Foglight APM Administrator (Foglight role) — configures Foglight to monitor web traffic for the selected web sites and web applications. |
|
• |
Foglight Administrator (Foglight role) — configures and manages Foglight, and performs administrative tasks, such as assigning user roles. |
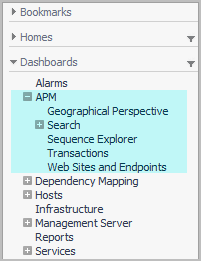 The APM menu contains the following menu items: