Spotlight Basics describes how Spotlight applications work. It contains these sections:
| Section |
Description |
|---|---|
| Spotlight Connections |
Create / Modify / Delete connections to systems, and monitor those systems. |
| Monitor Spotlight Connections | Monitor connections, detect alarms, investigate the cause of alarms. |
| Alarms |
Alarms are the warnings that Spotlight raises when a metric falls outside its "normal" range of values. |
| Charts, Grids and Home Page Components | Spotlight displays provide detailed statistics of the monitored system, relevant to diagnosing the cause of alarms. Make the best use of them. |
| View | Options | Customize Spotlight. |
| Troubleshooting | Solve problems using Spotlight. |
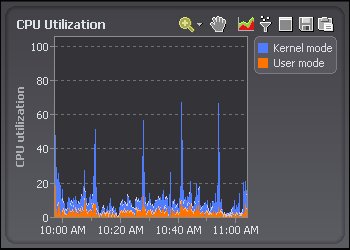
A chart is a component on a Spotlight page that shows data as a graphical image.
Notes:
| Click | Description |
|---|---|
 |
Zoom in on Charts |
 |
Pan Over Zoomed Charts |
 |
Set the Chart View |
 |
Filter on the Data Series |
  |
Maximize and Restore Charts |
 |
Save To File |
 |
Copy To Clipboard |
 |
The legend lists all the data series associated with the chart. Click an item in the legend to highlight its series in the chart. (Click a second time to return the series to its normal appearance.) Move the mouse pointer over an item in the legend to view the current value for that series within the chart. Note: Arrows at the top and bottom of a legend (if displayed) indicate that there are more items in the legend list. Click an arrow to scroll through the list. |
| Right click the table body and select What's This? | View help specific to the chart. |
| Right click the table body and select Print | |
| Right click the table body and select Restore Default Settings | Restore Default Settings |
| Right click the table body and select View as Grid. | View the data in a Spotlight grid. About Spotlight Grids |
| Right click the table body and select Properties. |
Adjust the chart properties: |
 |
If the diagnostic server is unable to collect the data required, Spotlight displays a small icon on the affected component. Click the icon to see more information about the problem. |
  |
Pause / Resume / Refresh |
The Zoom (applied to the horizontal and vertical axes of the chart) determines the scale.
You can zoom in on a section of a chart using one of the following methods:
| Action | Description |
|---|---|
|
Use the magnifying glass
|
Notes:
|
|
Use the drop-down menu
|
Note: Time options are not available in chart views without a time axis (bar charts, for example). |
Notes:

