You can edit the visual properties of the charts displayed in Spotlight.
To set chart properties
Configure as appropriate:
| Option | Description |
|---|---|
| Name | Select the chart to configure. Applicable when the chart name is selectable. |
|
Chart style |
Select a style for the chart. Notes:
|
|
Arrange by |
Applicable when the Chart style is set to Bar or Pie.
|
|
Include legend in chart |
Select to show the legend associated with the chart. Not all charts have a legend. |
|
Series are stacked |
Applicable when the Chart style is set to Area.
|
|
Manual scaling |
Select Manual Scaling to set the scaling factor for the chart in the Minimum value and Maximum value fields. Clear Manual Scaling to accept Spotlight's default scaling of the chart. |
A Spotlight chart may contain multiple graphs representing separate data series from multiple data sources. You can filter the chart so that it shows only the data series that you want to see.
Spotlight supplies a set of filters that you can use, but if none of the standard filters are suitable for your chart, you can design a custom filter.
To set a custom filter on a chart
Configure as appropriate:
| Option | Description |
|---|---|
|
Name |
Select the chart to configure. Applicable when the chart name is selectable. |
|
Show all items |
Select to display all current data series. For example, if a system has the multiple disks C:, D:, E:, and F:, the relevant disk usage chart displays the disk usage statistic for all four disks. |
|
Show only the top items |
Select to display the most significant data series. Select the number of data series to show from the associated drop down list. |
|
Show the following items |
Select to choose the data series to show. Select the data series to show from the associated list. Note also the associated Select all and Clear all buttons. |
Spotlight Basics describes how Spotlight applications work. It contains these sections:
| Section |
Description |
|---|---|
| Spotlight Connections |
Create / Modify / Delete connections to systems, and monitor those systems. |
| Monitor Spotlight Connections | Monitor connections, detect alarms, investigate the cause of alarms. |
| Alarms |
Alarms are the warnings that Spotlight raises when a metric falls outside its "normal" range of values. |
| Charts, Grids and Home Page Components | Spotlight displays provide detailed statistics of the monitored system, relevant to diagnosing the cause of alarms. Make the best use of them. |
| View | Options | Customize Spotlight. |
| Troubleshooting | Solve problems using Spotlight. |
A table or grid shows values in tabular form. The grid component is used in Spotlight alarms and drilldowns.
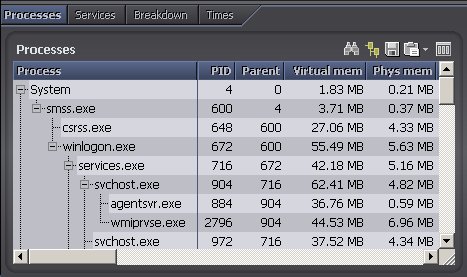
Actions common to Spotlight grids
Notes:
| Click | Description |
|---|---|
 |
Find Text |
 |
Alarms: Alarm Filters. |
 |
Tree View |
 |
Select Multiple Rows |
 |
Select Multiple Rows |
 |
Save To File |
 |
Copy To Clipboard |
 |
Show, Hide & Order Columns |
  |
Sort the Grid |
| Right click the table body and select What's This? | View help specific to the gird. |
| Right click the table body and select Print | |
| Right click the table body and select Restore Default Settings | Restore Default Settings |
| Right click the table body and select View as Chart. | View the data in a Spotlight chart. About Spotlight Charts |
| Right click the table body and select Properties. | Freeze the first column or word-wrap text. Grid Properties - Options Page |
 |
If the diagnostic server is unable to collect the data required, Spotlight displays a small icon on the affected component. Click the icon to see more information about the problem. |
  |
Pause / Resume / Refresh |
