立即与支持人员聊天
与支持团队交流

Foglight for Hyper-V 5.8.2 - User and Reference Guide

About Foglight for Hyper-V Agent administration Performance monitoring with the Hyper-V Environment dashboard Performance investigation with the Hyper-V Explorer Foglight for Hyper-V alarms Appendix: Hyper-V Agent error codes

Server monitoring

A Hyper-V server is a physical component required to begin building a virtual infrastructure. Hyper-V servers provide hypervisor-based architecture for controlling and managing resources for the virtual machines that run on it. Virtual machines running on a Hyper-V server share the server’s resources.

To review data collected about a specific server or all servers, make your selection in the Quick-View.

Servers view

The Servers view is a tree view. It lists the servers that exist in your environment and shows their state.

This view appears in the Quick-View on the left when you select the Servers tile in the Virtual Environment view.
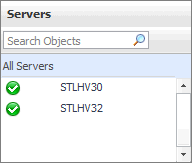
Figure 34. Servers view

Selecting the All Servers node displays overall resource utilization for all servers in your integrated system, and the elements that consume the highest amount of system resources in the Summary - All Servers view on the right. Similarly, selecting a server node shows server-specific metrics in the Server Summary view.

Alarm severity. The state of the most recent alarm raised against the associated server.
All Servers. A parent node for the server object instances that appear in this view.
Server. The server name.

Drill down on:

Summary - All Servers view

The Summary - All Servers view displays overall resource utilization information for a group of physical servers and shows the elements that consume the highest amount of system resources.

This view appears in the Quick-View on the left when you select All Servers in the Servers view.
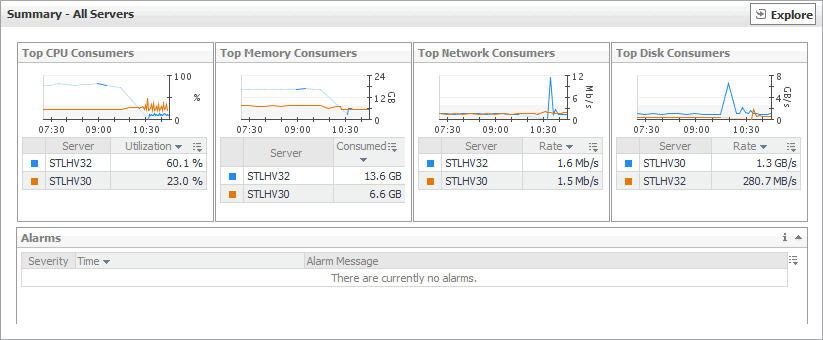
Figure 35. Summary - All Servers view

This view is made up of the following embedded views:

Table 21. Alarms

Lists the alarms generated against the monitored system.

Alarm Message. An explanation about why the alarm occurred.
Severity. Indicates the alarm severity: Warning, Critical, or Fatal.
Time. The time at which the alarm was generated.

Drill down on:

Severity. Displays the Alarm dialog box, showing additional information about the alarm. For more information about alarms in Foglight, see the Foglight User Help.
Figure 36. Alarm dialog box
Time. Links to the Server Summary view.

Shows the top three servers with the highest average CPU utilization.

Servers. The name of the server.
CPU Utilization.The total percentage of CPU utilization the top three CPU consumers spend on executing system code and user programs, during the selected time range.

Drill down on:

CPU Utilization (in the graph). Displays the Top Servers-CPU Utilization dialog box.
Figure 37. Top Servers - CPU Utilization dialog box

Shows the top three servers with the lowest available disk space.

Disk Transfer Rate. The rate at which the top three disk consumers read or write data to the disk during the selected time range.
Servers. The name of the server.

Drill down on:

Disk Transfer Rate (in the graph). Displays the Top Servers - Disk Transfer Rate dialog box.

Shows the top three servers with the highest average memory utilization.

Memory Consumed. The amount of memory the top three memory consumers use during the selected time range.
Servers. The name of the server that are the top three memory consumers.

Drill down on:

Memory Consumed. Displays the Top Servers - Memory Consumed dialog box.

Shows the top three servers that are consuming most network bandwidth.

Network Transfer Rate. The rate at which the top three network consumers transfer data to or from the network during the selected time range.
Servers. The name of the server that are the top three network consumers.

Drill down on:

Network Transfer Rate. Displays the Top Servers - Network Transfer Rate dialog box.

Server Summary view

The Server Summary view shows the overall resource utilization and the amounts of system resource consumption for a physical server.

This view appears in the Quick-View on the left when you select a server in the Servers view.
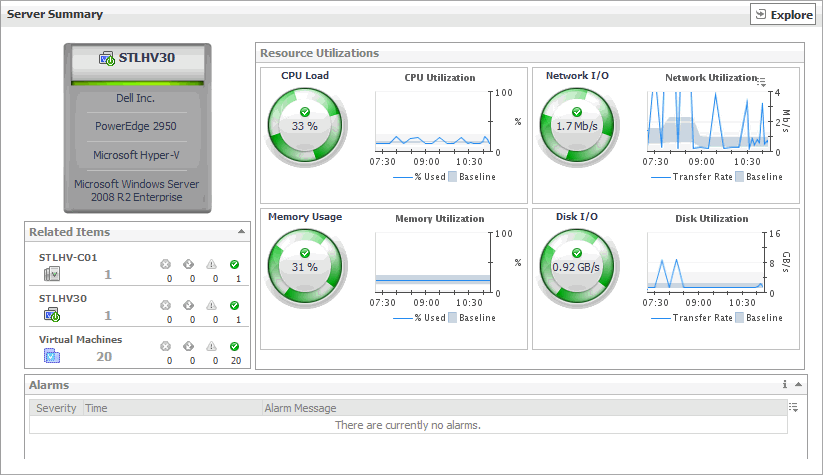
Figure 41. Server Summary view

This view is made up of the following embedded views:

Table 26. Alarms

Lists the alarms generated against the selected server.

Alarm Message. An explanation about why the alarm occurred.
Severity. Indicates the alarm severity: Warning, Critical, or Fatal.
Time. The time at which the alarm was generated.

Drill down on:

Alarm Message, Severity, or Time. Displays the Alarm dialog box, showing additional information about the alarm. For more information about alarms in Foglight, see the Foglight User Help.
Figure 42. Alarm dialog box
Table 27. Related Items

Shows the numbers and states of the cluster the selected server belongs to, the selected server, and the virtual machine running on the selected server.

Cluster. The name of the cluster to which the selected server belongs, followed by the counts of all alarms associated with the cluster, broken down by the alarm state (Normal, Warning, Critical, Fatal).
Server. The name of the selected server, followed by the counts of all alarms associated with that server, broken down by the alarm state (Normal, Warning, Critical, Fatal).
Virtual machines. The number of the virtual machines running on the selected server, followed by the counts of all alarms associated with those virtual machines, broken down by the alarm state (Normal, Warning, Critical, Fatal).

Drill down on:

Alarm count. Displays a dwell that shows the objects against which alarms are generated.
Cluster. Displays the Clusters dwell, showing the name and state of the cluster the selected server belongs to.
Figure 44. Clusters dwell
Server. Displays the Servers dwell, showing the name and state of the selected server.
Figure 45. Servers dwell
Virtual Machines. Displays the Virtual Machines dwell, showing the names and states of the virtual machines that are running on the selected server.
Figure 46. Virtual Machines dwell

Shows the resource consumption for the selected server broken down into four simple views.

CPU Load. The current percentage of the selected server’s CPU load, used to execute system code and user programs, based on the total CPU capacity.
CPU Utilization, % Used. The percentage of the server’s CPU utilization spent on executing system code and user programs during the selected time period.
CPU Utilization, Baseline. An envelope indicating the expected CPU utilization range based on historical data.
Disk I/O. The current disk I/O rate for the selected server.
Disk Utilization, Baseline. An envelope indicating the expected disk utilization range based on historical data.
Disk Utilization, Transfer Rate. The rate at which the server reads and writes data to the disk during the selected time period.
Memory Usage. The current percentage of the average memory usage by the selected server, based on the total memory capacity.
Memory Utilization, % Used. The percentage of the available memory that the server uses during the selected time period.
Memory Utilization, Baseline. An envelope indicating the expected memory utilization range based on historical data.
Network I/O. The current rate at which the selected server transfers data from and to the network.
Network Utilization, Baseline. An envelope indicating the expected network utilization range based on historical data.
Network Utilization, Transfer Rate. The rate at which the selected server transfers data from and to the network during the selected time period.

Drill down on:

CPU Load spinner. Displays the CPU Load dialog box.
Figure 47. CPU Load dialog box
CPU Utilization graph. Displays the CPU Utilization dialog box.
Figure 48. CPU Utilization dialog box
Disk I/O spinner. Displays the Disk I/O dialog box.
Figure 49. Disk I/O dialog box
Disk Utilization graph. Displays the Disk Utilization dialog box.
Figure 50. Disk Utilization dialog box
Memory Usage spinner. Displays the Memory Usage dialog box.
Figure 51. Memory Usage dialog box
Memory Utilization graph. Displays the Memory Utilization dialog box.
Figure 52. Memory Utilization dialog box
Network I/O spinner. Displays the Network I/O dialog box.
Figure 53. Network I/O dialog box
Network Utilization graph. Displays the Network Utilization dialog box.
Figure 54. Network Utilization dialog box

Shows the name of the selected server and its basic configuration, including the hardware configuration, virtualization application (Microsoft Hyper-V), and the OS.

相关文档

The document was helpful.

选择评级

I easily found the information I needed.

选择评级