Investigating Application details
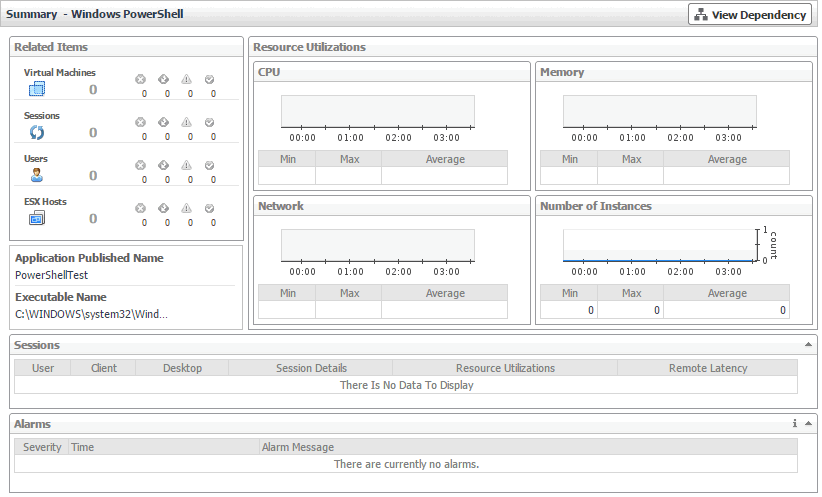
In your monitored environment, applications are delivered to end users on demand. You can review how individual applications are distributed to end users in the Summary - Application view. This view shows the usage of system resources for the selected Application. Use it to see the number of users that are using it, and to look more closely a individual application instances. A high number of users, for example, can lead to performance degradation, and should be investigated.

|
|
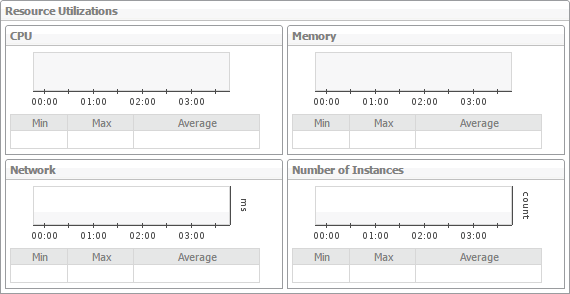
The minimum, maximum, and average values of CPU and memory utilization, network latency, and application instances, over the selected time range.

|
|
|
The objects that are associated with the selected application and their alarm state.

|
|
|
The name of the application published in your XenDesktop environment and the path to the application executable.

|
|
|
|
|
General information about the current application sessions, such as the name of the user associated with it, client name, desktop name, additional session details, resource utilization, and latency.

|
Monitoring Sessions
When an end user obtains access to a virtual desktop, this results in a desktop session. A session is a specific instance of an end user’s activity. For those desktops that are monitored by NetScaler agents, you can monitor their sessions. To do that, select the Sessions tile on the XenDesktop Environment dashboard. The information appearing in the XenDesktop Session Quick View can help you discover potential resource-level issues such as high session counts, and to reallocate resources where they are most needed.

|
3 |
In the XenDesktop Session Quick View, in the Sessions view on the left, click Session Overview. |
The XenDesktop Session Quick View refreshes, showing the
Summary - Session Overview view on the right.
|
4 |
In the Sessions view, under Desktop Session or Application Session, click a session. |
The XenDesktop Session Quick View refreshes, showing the
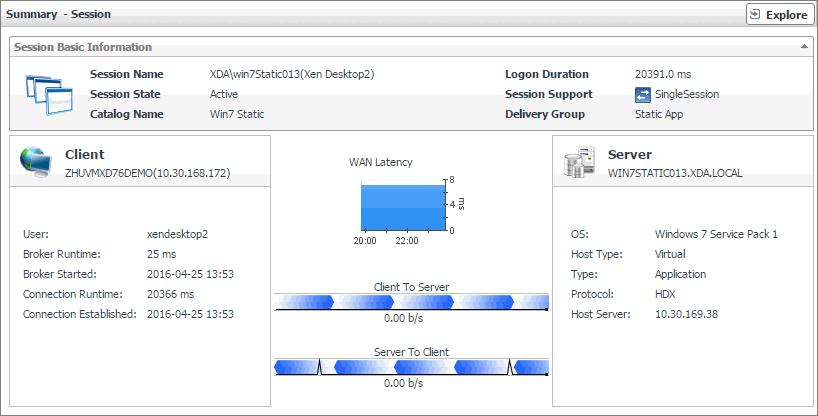
Summary - Session view on the right.
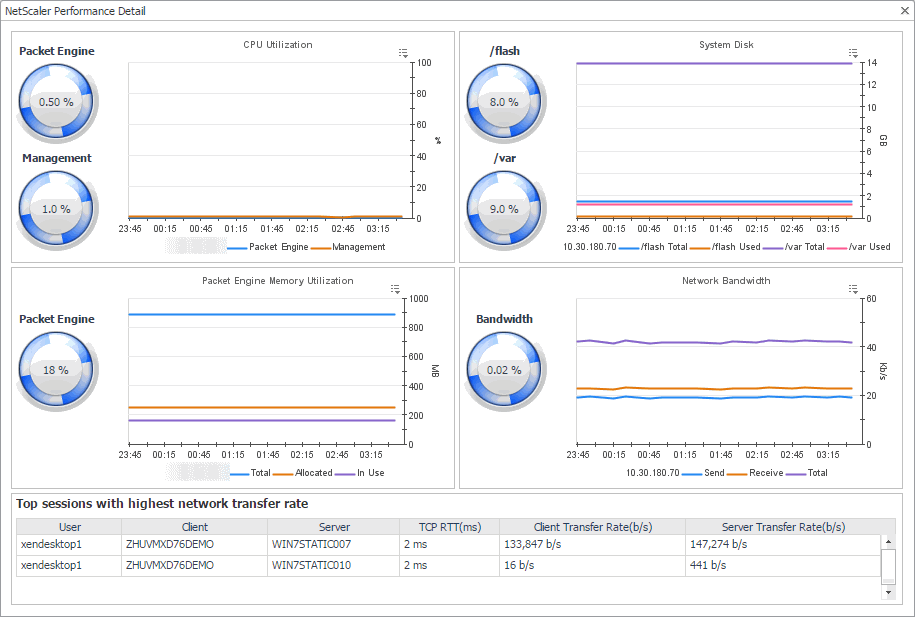
The NetScaler Performance Detail dialog box appears.
Observing the Session Overview
A session is a specific instance of an end user’s activity with a virtual desktop. You can view the performance of desktop or application sessions when you create and configure NetScaler agents to collect ICA (Independent Computing Architecture) session information from monitored Citrix® NetScaler® gateways using Citrix® AppFlow®. For more information about XenDesktop Session agents, see Creating NetScaler Agent instances .
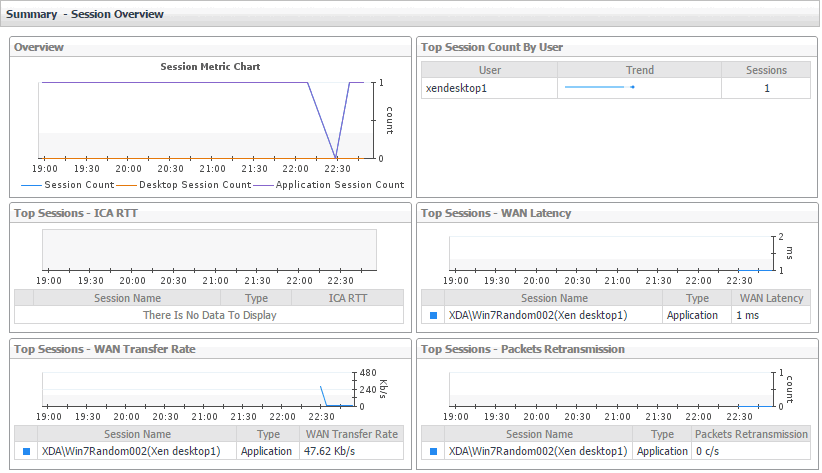
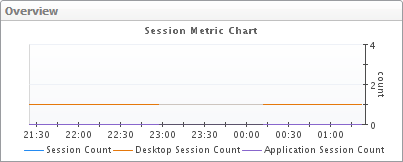
To get a good understanding of which desktops or applications consume the highest amounts of system resources, use the Summary - Session Overview view. For example, high peaks in the Session Metric Chart can indicate a sudden increase in the end-users’ activity that may result in compromised performance. This view can help you discover potential resource bottlenecks, and to reallocate resources where they are most needed.

Investigating Session details (NetScaler data)
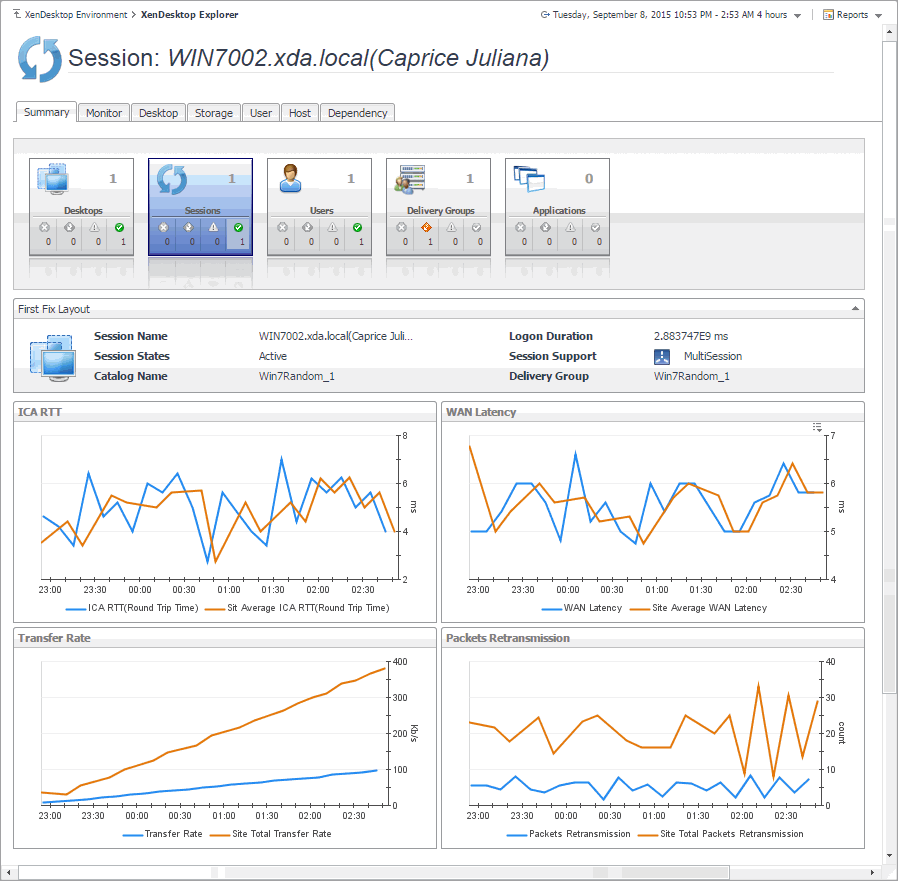
Information about a specific session can give you a good understanding about the end-user’s experience with virtual desktops and applications. NetScaler agents collect data about specific sessions, which populates the Summary - Session view. Use this view to better understand how end users interact with individual desktops and applications, and to how well your system responds to end-users’ requests. For example, high peaks in the latency data may indicate bottlenecks in desktop and application sessions and should be investigated. For more information about NetScaler agents, see Creating NetScaler Agent instances .

|
|
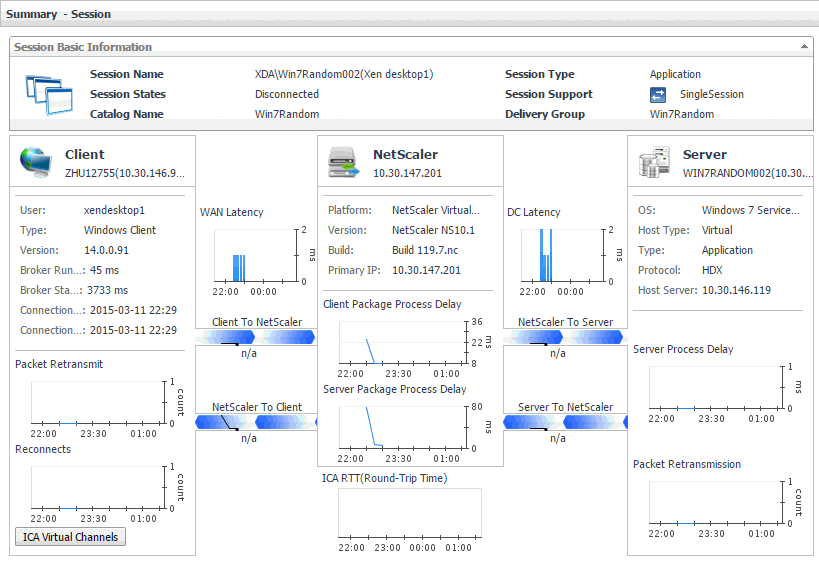
General information about the session, such as its name, state, catalog name, type (desktop or application), support type, and the delivery group to which it belongs.

|
|
|
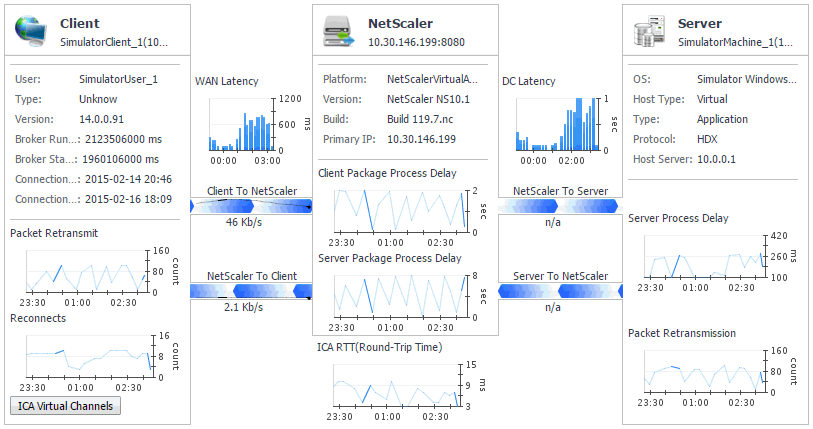
A monitoring dashboard that visualizes the main components in the selected session and their connectivity. This can help you understand the effect of these components may have on your system. Along with displaying the client, NetScaler gateway, and the application or desktop server, this intuitive view connects these elements with a series of graphical flows illustrating the transmission of the session data. For example, you can review the rates of data and flowing between the client, NetScaler gateway, and the application or desktop server, and identify any signs of potential network congestion that may affect your system.

|
|
|
Client: This embedded view shows the name and IP address of the machine accessing your XenDesktop environment. It also displays the following information:
|
• |
User: The name of the XenDesktop user. |
|
• |
Type, Version: The name and version number of the OS running on the client machine. |
|
• |
Broker Runtime: The amount of time the connection broker process has been running during its most recent connection attempt. |
|
• |
Broker Started: The amount of time that has passed since the broker process for the first time. |
|
• |
Connection Runtime: The date and time when the connection broker process has connected during its most recent connection attempt. |
|
• |
Connection Established: The date and time when the connection broker process has established the connection for the first time. |
|
• |
Packet Retransmit: The number of times data packets are re-sent after being lost or damaged over the selected time range. |
|
• |
Reconnects: The number of times the connection had to be re-established over the selected time range. |
|
• |
WAN Latency: The WAN latency rates between the client and the NetScaler gateway, over the selected time range. | |
|
|
NetScaler: This embedded view shows the name and IP address of the NetScaler gateway machine. It also displays the following information:
|
• |
Platform: The name of the NetScaler appliance. |
|
• |
Version, Build: The NetScaler version and build numbers. |
|
• |
Primary IP: The IP address of the NetScaler appliance. |
|
• |
DC Latency: The data center (DC) latency rates between the NetScaler gateway and the application or desktop server, over the selected time range. | |
|
|
Server: This embedded view shows the name and IP address of the XenDesktop server machine hosting the application or desktop associated with the selected session. It also displays the following information:
|
• |
OS: The name and version of the OS running on the server. |
|
• |
Host Type: The type of the host ( Physical or Virtual) on which the XenDesktop server is running. |
|
• |
Type: The session type ( Application or Desktop). |
|
• |
Protocol: The remote display protocol (for example, HDX). |
|
• |
Host Server: The IP address of the host machine on which the server is running. |
|
• |
Server Process Delay: The amount of time the server process is delayed, over the selected time range. |
|
• |
Packet Retransmission: The number of times data packets are re-sent after being lost or damaged, over the selected time range. | |

