Investigating the use of License Server, Delivery Controller, and Storefront resources
In your monitored environment, a Citrix License Server allows Citrix® licenses, including XenDesktop® licenses, to be shared among application components. Delivery Controllers distribute virtual desktops to end-users, manage user access, and optimize connections. Storefronts represent services that provide users with access to applications and desktops. You can review the performance of these components in the Summary - License Server and Summary - Delivery Controller views.
These views have two different layouts, depending on the tile selected on the left:
Application view
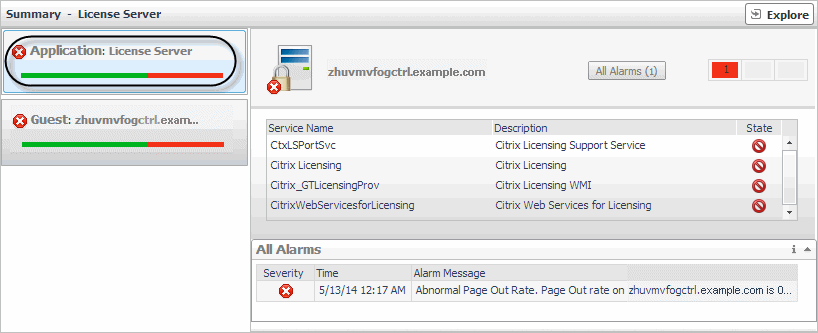
Selecting the Application tile, the view shows the list of services running on the selected License Server, Controller, or Storefront, and displays any alarms associated with it. Use this view to see which services are running on the selected component, and to review any generated alarms, if they exist. For example, a high number of application-level alarms often suggest performance bottlenecks and should be investigated.
|
The current alarm state of the selected component and its type (License Server or Delivery Controller). Selecting this tile displays the services associated with the selected component on the right. | |
|
Clicking All Alarms just above the service table lists all alarms associated with the selected component. Optionally, you can drill down on a specific severity level (Warning, Critical, or Fatal) by clicking the appropriate box in the table on the right of All Alarms, to see only alarms with a specific severity level (for example, Warning alarms). |
Guest view
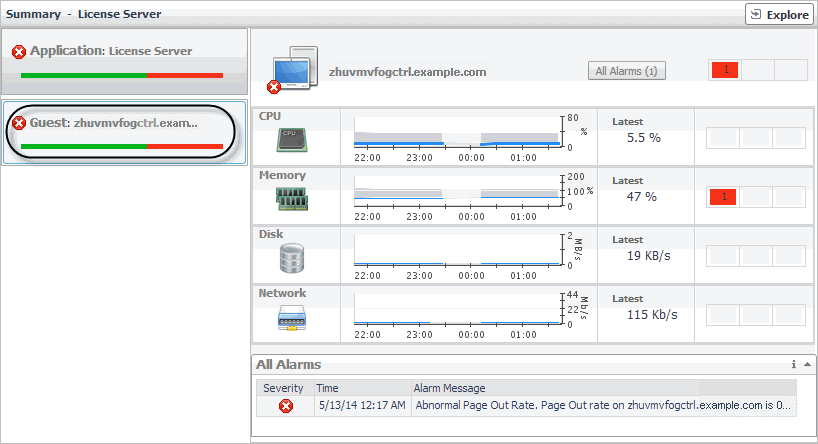
When you select the Guest tile, the view shows the usage of system resources on the machine on which the selected License Server or Controller is running. Use this view to see the trends in usage of the selected component’s system resources, and to review any generated alarms, if they exist. For example, high peaks in the memory utilization chart, that drastically exceed historical values could result in performance degradation and should be investigated.
|
The current alarm state of the selected component and its type (License Server or Delivery Controller). Selecting this tile displays the usage of system-level resources on the right. | |
|
The Latest percentage represents the current CPU utilization. | |
|
The Latest percentage represents the current memory utilization. | |
|
The Latest rate represents the current disk rate. | |
|
The Latest rate represents the current network transfer rate. | |
|
NOTE: Clicking All Alarms just above the service table lists all alarms associated with the selected component. Optionally, you can drill down on a specific severity level (Warning, Critical, or Fatal) by clicking the appropriate box in the table on the right of All Alarms, to see only alarms with a specific severity level (for example, Warning alarms). |


