The Summary tab in the SQL Optimizer window displays the Run Time information and the cost estimates from various perspectives.
The Run Time pane displays the run time statistics for retrieving all records and for retrieving the first record.
Cost statistics shown on the Summary tab are estimated cumulative costs across all operations used in the access plan. (missing or bad snippet)
|
Item |
Description |
|
Buffers |
The estimated cumulative number of logical read requests for data pages that have gone through the buffer pool. This value is expressed in 4KB page units. |
|
Communication |
The estimated cumulative communication cost of executing the access plan up to and including the operation specified in the selected step. This value is expressed in TCP / IP frame units. |
|
CPU |
The estimated cumulative number of CPU instructions required to execute the access plan up to and including the operation specified in the selected step. |
|
First row |
The estimated cumulative cost of fetching the first row of data for the access plan up to and including the operation specified in the selected step. This statistic is expressed in timeron units. |
|
First row comm . |
The estimated cumulative communication cost of fetching the first row of data for the plan up to and including the operation specified in the selected step. This statistic is expressed in TCP / IP frame units. |
|
I/O |
The estimated total number of I/Os required for the access plan, up to and including the operation specified in the selected step. This value is expressed in units of 4KB pages. |
|
Next row CPU |
The estimated cumulative number of CPU instructions required to fetch the second row of data for the plan up to and including the operation specified in the selected step. |
|
Next row I/O |
The estimated cumulative number of I/Os required to fetch the second row of data for the plan up to and including the operation specified in the selected step. This statistic is expressed in timeron units. |
|
Next row total |
The estimated cumulative cost of fetching the second row of data up to and including the operation specified in the selected step. This statistic is expressed in timeron units. |
The statistics from the grid are grouped together and displayed in charts.
To select how many records are displayed in the charts
Select the number from the Number of Alternatives list.
To select which statistic to use to select the records
Select the statistic from the By list.
To select the top or the bottom range of the statistic
Select Asc (Ascending) or Desc (Descending) from the Order option.
Use the pane-control buttons to reorganize the panes:
To display the statistics and charts
Click Chart and Statistics .
To display only the charts
Click Chart Only.
To display only the statistics
Click Statistics Only .
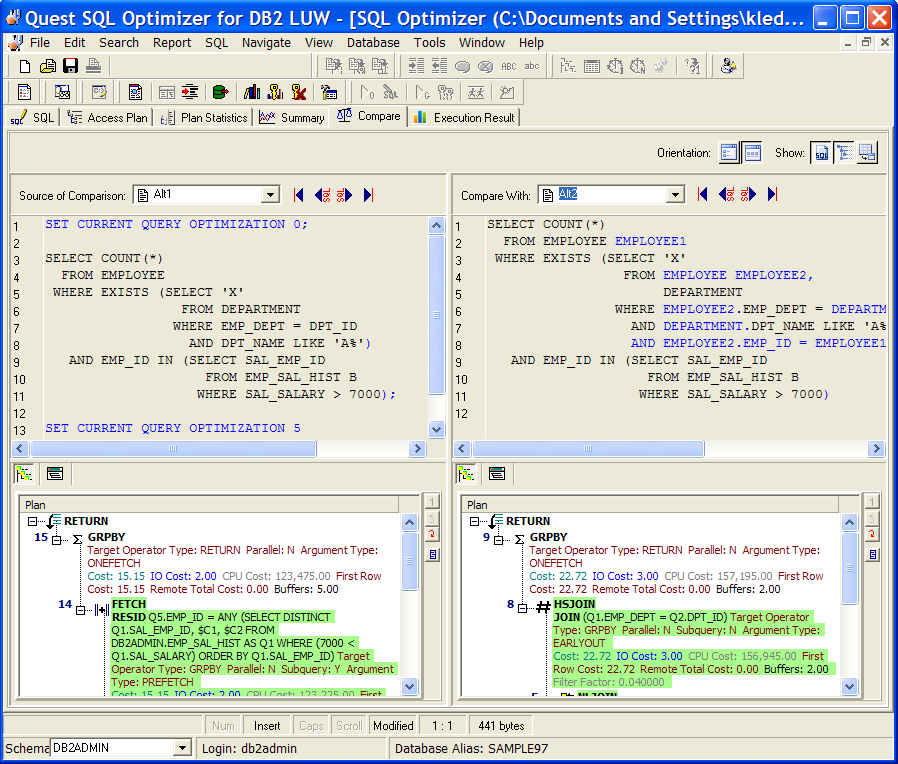
The Compare tab in the SQL Optimizer window enables you easily to compare SQL text, access plans, and statistics between two alternatives or between an alternative and the original SQL.
The Compare tab consists of two major panes—Source of Comparison and Compare With. Each pane shows information for one alternative. Differences in syntax and access plans are highlighted in either pane.
Use the pane-control buttons to reorganize the panes:
To display panes vertically
Click .
To display panes horizontally
Click .
To display or remove SQL Text panes
Click .
To display or remove Access Plan panes
Click .
To display or remove Statistics panes
Click .
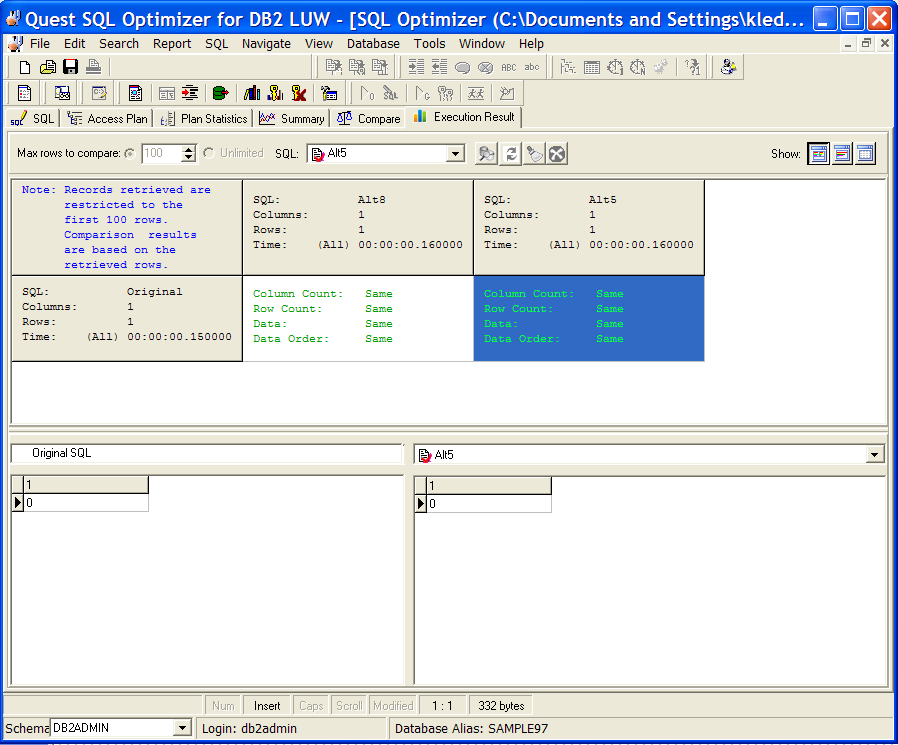
The Execution Result tab in the SQL Optimizer window compares the data returned by the original SQL with the data returned by any one of the SQL alternatives.
To compare all rows of data between the original SQL and an SQL alternative
 .
. To compare a limited number of rows between the original SQL and an alternative
. The grid in the top pane provides quick overview of returned-data differences. The numbers of returned columns and rows show whether the SQL alternative produces the same result as the original SQL statement. The displayed time shows how long it took to execute Batch Run or the Run Time, not the time it took to retrieve the data for the Execution Result tab.
Note: If the Data statistic shows that the returned data differs when you retrieve limited rows, do not assume that the alternative is returning wrong data. The difference can suggest that the alternative has returned data in an order different from the order returned by the original SQL. Two SQL statement are considered to be semantically equivalent if they retrieve the same data in any order (as long as the ORDER BY clause is not used in the SQL statement).
To refresh the data for the currently selected alternative
Click 
To clear all the data for original and all alternatives
Click 
To abort Compare SQL or Refresh SQL process
Click 
Quest SQL Optimizer for IBM® DB2® LUWmaximizes SQL performance by automating the manual, time-intensive and uncertain process of ensuring that SQL statements are performing as fast as possible. SQL Optimizer analyzes, rewrites, and evaluates SQL statements within multiple database objects, files, or SQL statements captured by the DB2 Event Monitor. With SQL Optimizer, you can analyze and optimize all your problem SQL from multiple sources. SQL Optimizer also provides you a complete index optimization and plan change analysis solution, from index recommendations to simulated index impact analysis, through comparison of multiple SQL access plans.
SQL Optimizer provides you with the following main modules.
SQL Optimizer (including SQL Rewrite and Generate Indexes functions)

 View the Summary tab