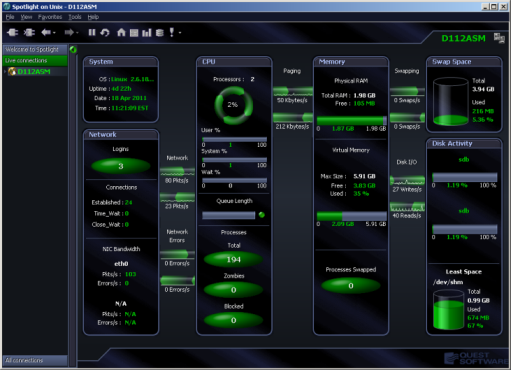
The Spotlight home page shows the flow of information and commands between various sub-components and the size and status of internal resources such as processes, disk files and memory structures.
Related operating system statistics are grouped together on panels that are connected by a series of graphical flows and icons. Spotlight updates these flows in real time so you can see how quickly data is moving through the system. The icons change color as Spotlight alarms are raised, upgraded, downgraded and canceled.
The display is based on the Windows architecture diagram. Windows Architecture Overview
To see the Spotlight on Windows Home Page
 .
. 
 |
|
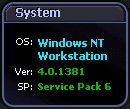
Displays information about the operating system of the machine you are currently connected to. OS — Operating system — The version name of the Windows operating system that is installed on the target machine. Ver — Version — The full version number of the Windows operating system installed on the machine. SP — Service pack — The name of the service pack installed on the machine (if any). |
|
|
|
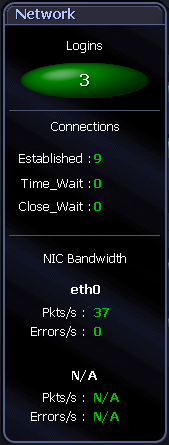
The Network panel shows the total number of connected users, and the rate at which packets are being sent from and received by the system: Windows Networking Users — Shows the number of clients connected to this system.
Open Sessions — The current number of Windows Networking sessions open on this machine.
Theoretical Bandwidth Limit — Shows the level of network traffic graphed against a "theoretical" maximum bandwidth for the network card specified. If there are multiple network cards, use Windows Network Card Display to select the one whose data you want to display.
Selected Network Card — The name of the network interface card (NIC) selected for diagnosis. If there are multiple network cards, use Windows Network Card Display to select the one whose data you want to display.
NBT KB Received — Represents the rate at which NetBios TCP/IP data is being received by the system from Windows Networking clients. NBT KB Sent — Represents the rate at which NetBios TCP/IP data is being sent from the system to Windows Networking clients.
Total KB Received — Represents the rate at which network data is received by the system from other network systems. Total KB Sent — Represents the rate at which network data is being sent from the system to other network systems. |
 |
|
The Event Logs panel provides a link to the Event Log drilldown.
Note: This button is enabled on Enable Event Logs selected. Windows Event Log Metrics |