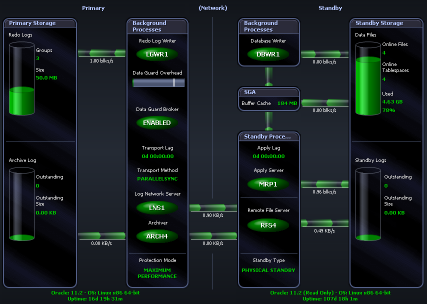
The Spotlight home page shows the flow of information and commands between various sub-components and the size and status of internal resources such as processes, disk files and memory structures.
Related statistics are grouped together on panels that are connected by a series of graphical flows and icons. Spotlight updates these flows in real time so you can see how quickly data is moving through the environment. The icons change color as Spotlight alarms are raised, upgraded, downgraded and canceled.
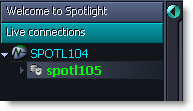
To see the Spotlight on Oracle Data Guard Home Page
Select the Standby database. Standby databases are indented from the Primary and show the Data Guard icon.