In Predictive Diagnostics charts, a prediction interval is used to indicate the range where the future values of a specified Cost Metric or Bottlenecks are expected to lie. The sample chart below shows such a prediction interval.
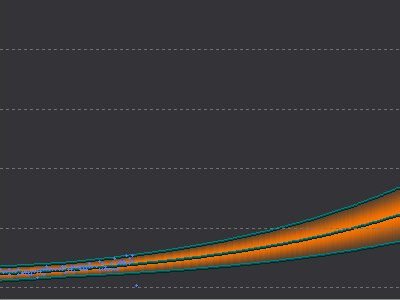
The prediction interval is generated from the (blue) raw data points, and indicates the range where future values are expected to lie.
The orange region is the prediction interval, the region where the future values of a specified Cost Metric or Bottlenecks are expected to lie. Since most of the future data points SHOULD be closer to the prediction line than the outer lines, we also need to indicate WHERE future points are likely to reside within the prediction interval. We do this via the color density of the orange band.
The color density is NOT uniform — the band is most dense near the prediction line, where we expect most future values to occur, and less dense at the outer boundaries, where fewer data points will occur. If the boundary lines enclose 95% of the raw data points, we expect 68% of the future data points to reside in the central half of the prediction interval.
Flaring of the Prediction Interval
The flaring of the prediction interval with time indicates that the further into the future that predictions are made, the less accurate they will be. The amount of flare is determined by how closely the raw data points cluster around the prediction line.
