Chat now with support
Chat with Support

SharePlex Manager 3.0 - User Guide

Instance Detail

The Instance Detail view displays detailed information about the source and target instances in a replication stream as well as the status of the Capture, Read and Export processes on the source instance and the Import and Post processes on each target instance.

In Replication Overview or Instance Overview, click the name of the replication stream you want to view in the Stream Name column.

You can view more detailed information about any process displayed in the Instance Detail view by opening the drop-down menu on the jeweled disk on any process and selecting Show Details. This links to the following:

This view is made up of the following embedded views:

The Capture Process Detail view displays various performance-related information about the Capture process of a source SharePlex instance.

From Instance Detail, open the drop-down menu on a Capture jeweled disk and select Show Details.

This view is made up of the following embedded views:

The Read Process Detail view displays various performance-related information about the Read Process of a source SharePlex instance.

From Instance Detail, open the drop-down menu on a Read jeweled disk and select Show Details.

This view is made up of the following embedded views:

The Post Process Detail view displays various performance-related information about the Post Process of a target SharePlex instance.

From Instance Detail, open the drop-down menu on a Post jeweled disk and select Show Details.

This view is made up of the following embedded views:

The Import Process Detail view displays various performance-related information about the Import Process of a target SharePlex instance.

From Instance Detail, open the drop-down menu on a Read jeweled disk and select Show Details.

This view is made up of the following embedded views:

The Export Process Detail view displays various performance-related information about the Export Process of a source SharePlex instance.

From Instance Detail, open the drop-down menu on a Read jeweled disk and select Show Details.

This view is made up of the following embedded views:

Users that have been granted control rights for a particular replication stream can execute control commands on the processes within that stream directly from the Instance Detail window. In the case of Capture, Read, and Post processes, users can also execute commands from the menu bar in the Process Detail window. SharePlex Manager currently supports the following control commands:

Start - Starts a stopped process
Stop - Stops a process once it completes any currently active transactions
Abort - Stops a process immediately
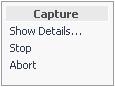
To execute control commands from the Instance Detail window, open the drop-down menu next to the process and select the command you want to execute.

Figure 1

If the process is currently stopped, the only option is Start. If the process is currently running, options include Stop and Abort.

To execute control commands for a Capture, Read, Export, Import, and Post process from a Process Detail window, open the drop-down menu next to the process and select Show Details. Then in the Process Details window, click the command button you want to execute in the menu bar.

Figure 2

While the command is being processed a pending icon is displayed.

Figure 3

Stopped and aborted process are indicated by a yellow jewel disk and the process status, Stopped by user.

Viewing, Clearing and Ignoring Events

SharePlex Manager allows you to view the SharePlex event log generated for the associated SharePlex instance. Also, you can use SharePlex Manager to remove or ignore clearable error and warning messages from event logs. Clearing messages removes them from the status database, but still retains them in the overall event log, which helps keeps the log up-to-date with the most current information. Ignoring an event, on the other hand, configures SharePlex Manager to stop issuing warning and error alerts for the event but does not remove the event itself from the status database.

To view, clear and ignore events, you must have control permissions for the replication stream that the SharePlex instance belongs to.

Viewing Events

In SharePlex Manager, Oracle event logs are instance-specific, which means there are not separate logs for replication streams or individual processes. To view an event log, either click the log icon in the Events column in the Instance Overview or Instance Details window, or click View Event Log in an Event Details window. This opens the Oracle event log for the associated instance. In the Replication Overview window, the Event Details window features a separate View Event Log button for each instance in the replication stream.

Clearing Events

You can remove clearable errors and warnings from an Oracle event log. Clearable events are indicated by a corresponding checkbox in an Event Details window. Clear the events you want by selecting the corresponding checkbox of each event and clicking Clear Events.

Related Documents

The document was helpful.

Select Rating

I easily found the information I needed.

Select Rating