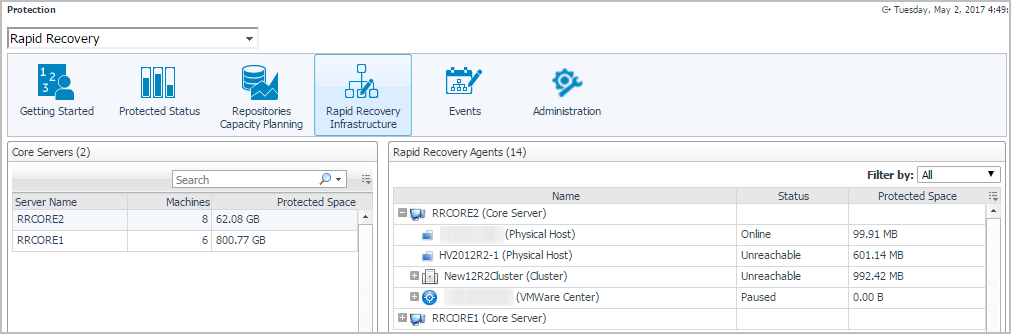
The Rapid Recovery Infrastructure view of the Protection dashboard shows the infrastructure of the service scoped Rapid Recovery Core servers. The Rapid Recovery Infrastructure view includes the following two tables:
|
3 |
On the navigation panel, under Homes, click Protection. |
|
5 |
On the menu bar, click the Rapid Recovery Infrastructure tab. |
| |||
| |||
| |||
 |
| |||
| |||
|
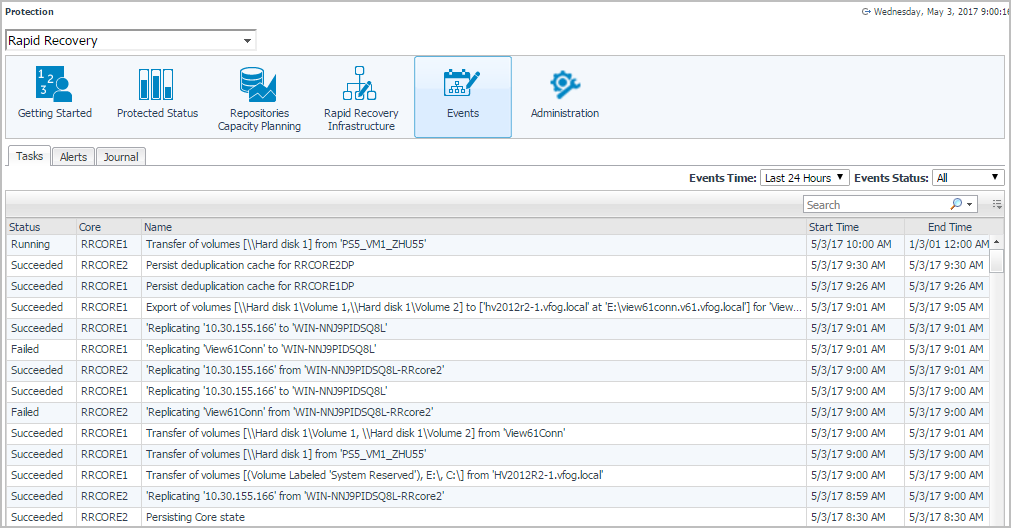
The Events view of the Protection dashboard shows events for the Core, a specific protected or replicated machine in the monitored Rapid Recovery environment. The Events view includes the following three tabs:
|
• |
Tasks tab: A task is an event related to a job. A job is a process that the Rapid Recovery Core must perform. Each job has a current state, and a start and end time and date. Some tasks are initiated manually or scheduled by the user. Examples include forcing a snapshot, scheduling a backup, or performing a restore from a recovery point. Other tasks are automatic functions, such as running nightly jobs, or performing rollup using the default retention policy. |
|
• |
Alerts tab: An alert is a priority event, such as an error, warning, or important informational message. If you request notifications of any specific events, these notifications appear in the Alerts subset. |
|
• |
Journal tab: The Journal tab shows a complete list of all logged events (for the Core, or the selected machine, as appropriate). This list is more comprehensive, showing jobs, high priority events, and lower priority events. This category includes passive and non-job events (such as the Core starting successfully, or reporting status from the license portal). |
|
3 |
On the navigation panel, under Homes, click Protection. |
|
5 |
On the menu bar, click the Events tab. |