The Menu bar contains the following tabs: Getting Started Tab, Protected Status Tab, Repositories Capacity Planning Tab, Rapid Recovery Infrastructure Tab, Events Tab, and Administration Tab.
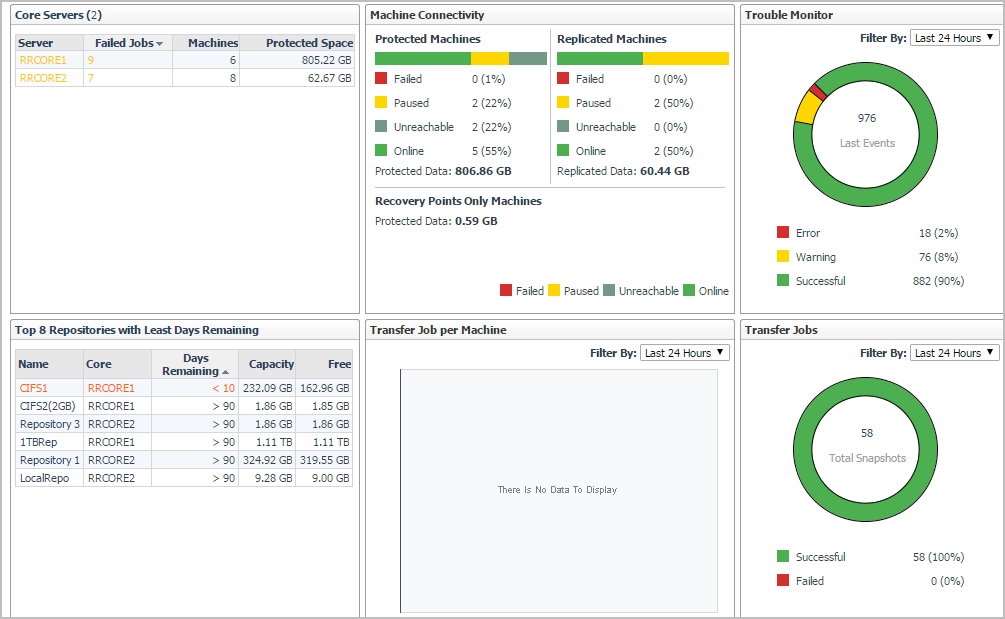
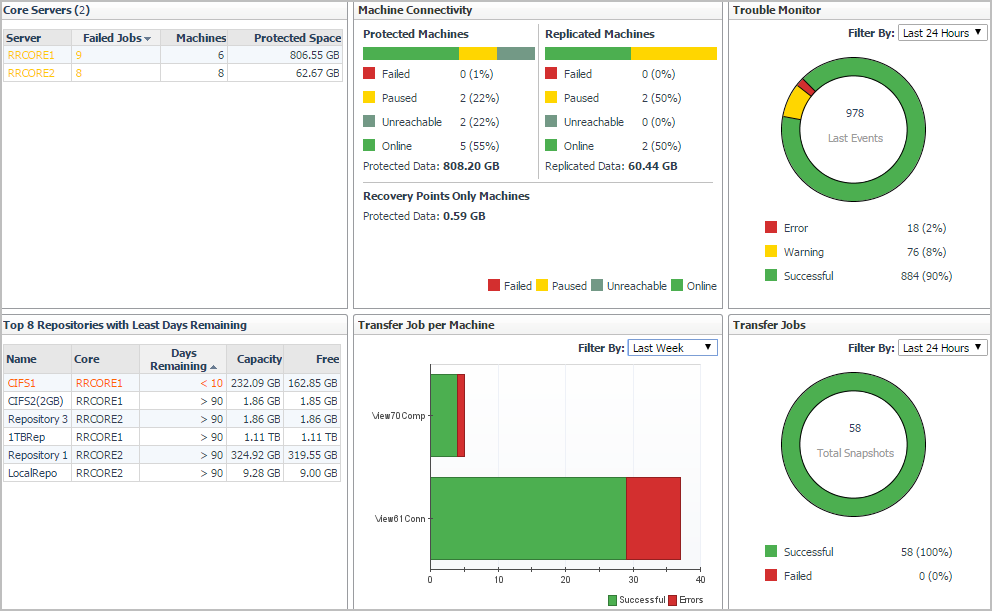
The Getting Started view of the Protection dashboard shows the data collected in the Rapid Recovery Core Servers.
|
3 |
On the navigation panel, under Homes, click Protection. |
The Getting Started view includes the following tables:
|
• |
Core Servers: This table lists the monitored Rapid Recovery Core Servers. Click this link to navigate to the Rapid Recovery Infrastructure Tab. For more information, see Rapid Recovery Infrastructure Tab. |
|
• |
Machine Connectivity: This table shows the connectivity state of machines protected and replicated on the monitored Rapid Recovery core. It also shows connectivity for data on recovery points-only machine. For more information about recovery points-only machine, refer to the Rapid Recovery Help. |
|
• |
Trouble Monitor: This table shows job activity, connections with the license portal, and transfer activity to detect early on the monitored Rapid Recovery core. The time range is configurable, defaulting to last 24 hours. Click this graph to navigate to the Events > Journal tab. For more information, see Journal tab. |
|
• |
Top 8 Repositories with Least Days Remaining: This tables shows the top eight repositories with the least days remaining on the monitored Rapid Recovery core. Click this link to navigate to the Repositories Capacity Planning Tab. For more information, see Repositories Capacity Planning Tab. |
|
• |
Transfer Job per Machine: This table shows, by protected machine of which the latest transfer job is failed, the number of successful and failed transfer jobs in the specified time range. This table shows the top ten machines with the most failed transfer job. The time range is configurable, defaulting to last 24 hours. Click this graph to navigate to the Events > Tasks tab. For more information, see Tasks tab. |
|
• |
Transfer Jobs: This table shows all snapshot data transfers (including base images and incremental snapshots) that completed in the specified time range. The time range is configurable, defaulting to last 24 hours. Click this graph to navigate to Events > Tasks tab. For more information, see Tasks tab. |
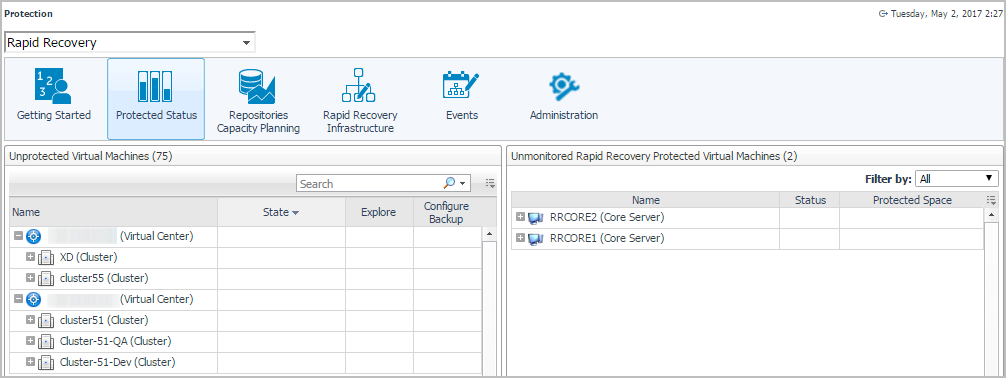
The Protected Status view of the Protection dashboard shows the unprotected virtual machines and unmonitored Rapid Recovery Protected virtual machines on the monitored Rapid Recovery Core. The Protected Status view includes the following two tables:
|
• |
|
3 |
On the navigation panel, under Homes, click Protection. |