|
Client: Use this option to filter jobs for a particular client. Plugin: Use this option to filter jobs performed using a particular plug-in. Job Type: Use this option to filter jobs by job type. You can select backup, restore, or reporting job types. Group By: Use this option to group jobs by Day, Week, Month, Quarter, or Year. Record limit: Use this option to set the number of records to display on a widget. By default 7 records are displayed. Duration: Use this option to filter jobs that completed at a particular duration. From: To filter jobs from a specific date and time, do the following:
To: To filter jobs up to a specific date and time, do the following:
Select Policies: Use this option to filter the policy jobs by their policy name. | |||||||||
|
Client: Use this option to filter jobs for a particular client. Plugin: Use this option to filter jobs performed using a particular plug-in. Policy: Use this option to filter the policy jobs by their policy name. Job Type: Use this option to filter jobs by job type. You can select backup, restore, or reporting job types. Record limit: Use this option to set the number of records to display on a widget. By default 10 records are displayed. Duration: Use this option to filter jobs that completed at a particular duration. From: To filter jobs from a specific date and time, do the following:
To: To filter jobs up to a specific date and time, do the following:
| |||||||||
|
Show space in: Use this option to show the media space in Bytes, KB, MB, GB, TB, or PB. Record limit: Use this option to set the number of records to display on a widget. By default 40 records are displayed. Select media groups: Use this option to filter the records on the basis of media group. By default, all media groups are selected. | |||||||||
|
Client: Use this option to see the client status for a particular client. By default, all the clients are selected. | |||||||||
|
Select reason: Use this option to set the reason for unusable media such as ASF, Bad, Foreign, Full, Offline, Other, Read Only, or Unusable. By default, all reasons are selected. Record limit: Use this option to set the number of records to display on a widget. By default 100 records are displayed. Select media groups: Use this option to filter the records on the basis of media group. By default, all media groups are selected. | |||||||||
|
Device Type: Use this option to set the type of device as RAS Devices, Tape Drives, or Tape Libraries. By default, all the device types are selected. | |||||||||
|
Policy Status: Use this option to filter the policies by status as Complete, Failed, or Warning. By default, all statuses are selected. Policy State: Use this option to filter the policies by state as Active, Dormant, Quiesced, or Quiescing. By default, all states are selected. | |||||||||
|
Select Interval: Use this option to filter the events by time interval as 5 min, 10 min, 30 min, 1 Hr, 8 Hr, 12 Hr, or 24 Hr. By default, the time interval is set to 10 min. Select Event Type: Use this option to filter the events by type as Error Only, Key Events, or All Events. By default, Error Only event type is selected. | |||||||||
|
Select Interval: Use this option to filter the logs by time interval as 5 min, 10 min, 30 min, 1 Hr, 8 Hr, 12 Hr, or 24 Hr. By default, the time interval is set to 10 min. Select Level: Use this option to filter the logs by level as Background, Error, Information, Job Messages, server, or Warnings. By default, all levels are selected. Select Classes: Use this option to filter the logs by class as Database, devices, Jobs, Media, Plugins, Schedule, System, or UI. By default, all classes are selected. | |||||||||
|
Client: Use this option to filter jobs for a particular client. Plugin: Use this option to filter jobs performed using a particular plug-in. Policy: Use this option to filter the policy jobs by the policy name. Job Type: Use this option to filter jobs by job type. You can select backup, restore, or Record limit: Use this option to set the number of records to display on a widget. By default 10 records are displayed. Duration: Use this option to filter jobs that are completed at a particular duration. From: To filter jobs from a specific date and time:
To: To filter jobs up to a specific date and time:
|
You can monitor the progress and status of your jobs from the Job Status page. You can also use this page to manage your jobs and perform various job-related tasks.
|
1 |
In the Navigation pane, click Job Status. |
|
2 |
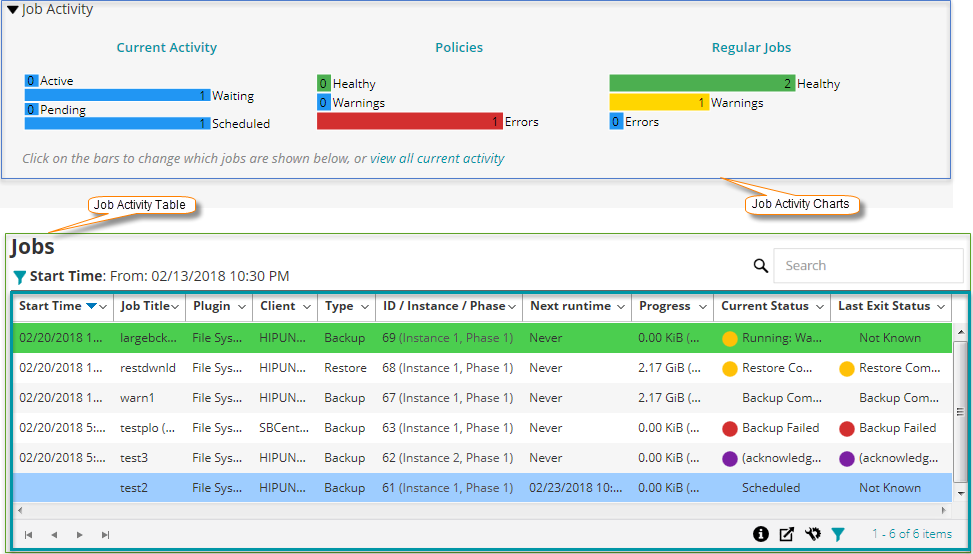
On the Job Status page, you can view the following information. |
You can click a job activity to display the job details for that category in the job activity table. For example, you can click Policies in the Job Activity area to display the policy jobs in the job activity table. You can click a bar in the activity chart area to display the job details for that category in the activity table. For example, you can click the Active bar in the Current Activity area to display the jobs that are in progress. To return to the default view type for the activity table, click the View all current activity link. To hide the job activity statistics on Job Status page, follow these steps:
| |||||||||||||
|
By default, the table lists all current job activities (All activity category). You can also add or remove following additional columns using the column menu: Policy Name, ID (shows only the job ID), Instance (shows only the job instance), Phase (shows only the job phase), Selection Set, Plugin Options Set, Schedule Set, Source Set, Target Set, Advanced Options Set, Duration (Displays the time in hours: minutes: seconds to complete the operation for backup/restore/reporting). For more information, see Sorting records in NetVault Backup WebUI.
The following row background colors are displayed for a job based on current status:
You can change the view type and also filter the records displayed in the table: Change the view type: To view the job details for a different job category, click the corresponding bar in the activity chart area. For example, to view the jobs that have completed with warnings, click the Warnings bar in the Regular Jobs area. |
|
4 |
You can use the Search option to filter the table data and quickly find entries that contain the specified string in any column values. You can also include wildcards (“?” or “*”) in the search filter string. |
You can view your jobs for a month, a week, or a day on a calendar. It can be helpful to view your jobs in the calendar format to ensure that there are no scheduling conflicts. You may want to verify the calendar before you create a job. You can monitor the progress and status of your jobs from the Job Calendar page. You can also use this page to manage your jobs and perform various job-related tasks.
|
1 |
In the Navigation pane, click Job Calendar. |
|
2 |
On the Job Calendar page, you can view the following information. |
| |||||||||||||||
|
This area displays the jobs on the calendar based on Filter By Status and Timeslot Size settings. Monthly view: Displays the jobs for the month. The height of the job is fixed in this view. Weekly view: Displays the jobs for a week. The height of the job is corresponding to the time taken to run the job. Daily view: Displays the jobs for a day. The height of the job is corresponding to the time taken to run the job. The Red color line on the Job Calendar shows the current time. |