Chat now with support
Chat with Support

Foglight Hybrid Cloud Manager 6.0.0 - User Guide (for AWS environments)

Using Foglight Hybrid Cloud Manager for AWS Monitoring Tab System Info Tab Tags Tab Report Tab Rule Configuration Tab Administration Tab Optimizer Tab Cost Tab Policy Management Tab

Summary - All EC2 Instances view

The Summary - All EC2 Instances view displays overall EC2 instance information. This view appears on the right when you select All EC2 Instances in the EC2 Instances view.

Figure 16. Summary - All EC2 Instances view

This view consists of the following embedded views:

Table 21. Alarms

Lists the alarms generated against the monitored virtual machine.

Description. An explanation about why the alarm occurred.
Severity. Indicates the alarm severity: Warning, Critical, or Fatal.
Title: Indicates the alarm title.
Ack’ed. Indicates whether the alarm was acknowledged.

Drill down on:

Description, Severity, Title, or Ack’ed. Displays the Alarm Created dialog box, showing additional information about the alarm. For more information about alarms, see the Foglight User Help.

Shows the top three EC2 instances with the highest average CPU utilization.

Utilization. The amount of CPU processing speed each of the top three CPU consumers spend on executing system code and user programs, during the selected time range.
EC2 Instance. The name of the EC2 instance.

Shows the top three EC2 instances that are consuming most network bandwidth.

Rate. The rate at which the top three network consumers transfer data to or from the network during the selected time range.
EC2 Instance. The name of the EC2 instance that is one of the top three network consumers.

Shows the top three EC2 instances with the highest average memory utilization.

EC2 Instance. The name of the EC2 instance that is one of the top three memory consumers.
Rate. The amount of memory the top three memory consumers use during the selected time range.

Shows the top three EC2 instances with the highest average volume utilization.

Rate. The rate at which the top three volume consumers transfer data to or from the network during the selected time range.
EC2 instance. The name of the EC2 instance that is one of the top three volume consumers.

Shows stopped instances based on the configurations.

Table. Shows the instance name, stop date, reason and so on.
Configure. Configures the days to judge which instances are stopped instances.

EC2 Instance Summary view

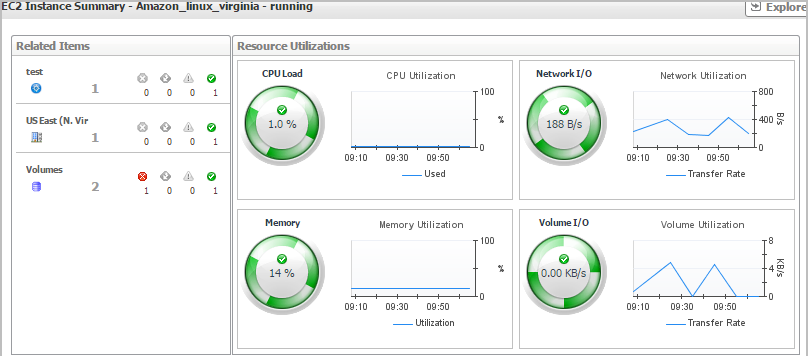
The EC2 Instance Summary view shows the overall information of the selected EC2 instance. This view appears on the right when you select an EC2 instance in the EC2 Instances view.

Figure 17. EC2 Instance Summary view

This view consists of the following embedded views:

Table 27. Alarms

Lists the alarms generated against the selected EC2 instance.

Alarm Message. An explanation about why the alarm occurred.
Severity. Indicates the alarm severity: Warning, Critical, or Fatal.
Time. Indicates when the alarm occurred.

Drill down on:

Alarm Message, Severity, or Time. Displays the Alarm Created dialog box, showing additional information about the alarm. For more information about alarms, see the Foglight User Help.
Table 28. Related Items

Shows the numbers and states of the selected resource group on the monitored AWS environment.

Disk Usage. Indicates total Disk Usage throughput across all EC2 Instances monitored by the Region.
Network I/O. Indicates total network throughput across all EC2 Instances monitored by the Region.
CPU Load. Shows the average CPU Load on all EC2 Instances for the Region based on the total capacity.
Memory. Shows the Memory Utilization summary for the specified Region based on the total capacity.

Drill down on:

CPU Load. Displays the CPU Load dialog box, including CPU Utilization and Baseline.
Memory. Displays the Memory Usage dialog box, including Memory Utilization and Baseline.
Network I/O. Displays the Network I/O view, showing the metrics of network Usage (in bps) and Baseline.
Disk Usage. Display the Disk Usage view, showing the metrics of disk Usage and Baseline.

Explore - Instance view

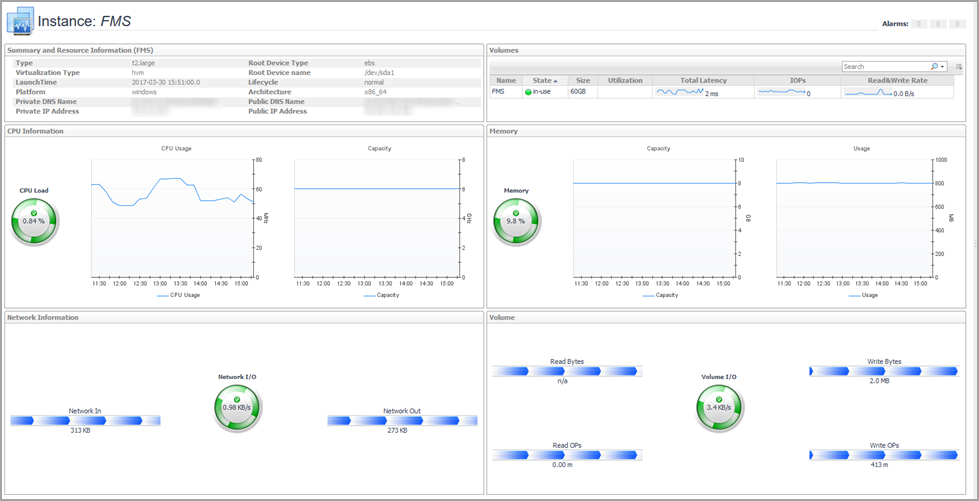
The Explore - Instance view appears when you click Explore in the EC2 Instance Summary view.

Figure 18. Explore - Instances view

This view consists of the following embedded views:

Table 29. Volumes

Shows the volumes that used by this instance. Table will show the name, state, size, utilization and so on.

Drill down on:

Description, Severity, Title, or Ack’ed. Displays the Alarm Created dialog box, showing additional information about the alarm. For more information about alarms, see the Foglight User Help.
Table 30. CPU Information

.Shows CPU capacity, usage, and utilization.

Utilization. Jumps to the Utilization dialog box.
Usage. Jumps to the Usage dialog box.
Capacity. Jumps to the Capacity dialog box.
Table 31. Memory

Shows Memory capacity, usage and utilization.

Utilization. Jumps to the Utilization dialog box.
Usage. Jumps to the Usage dialog box.
Capacity. Jumps to the Capacity dialog box.

Shows Network in, Network out, and transfer rate.

Network in: Jumps to the Network in dialog box.
Network out. Jumps to the Network out dialog box.
Transfer rate. Jumps to the Transfer rate dialog box.

Shows the basic information about the selected EC2 instance, including EC2 instance type, name and type of the root device, DNS name, IP address and so on.

Table 34. Volume

Shows Total volume read bytes, write bytes, and utilization.

Read bytes: Jumps to the Read bytes dialog box.
Write bytes. Jumps to the Write bytes dialog box.
Utilization. Jumps to the Utilization dialog box.

EBS monitoring

The EBS view shows the data collected about a specific EBS or all EBSs. For more information, see the following topics:

Related Documents

The document was helpful.

Select Rating

I easily found the information I needed.

Select Rating