Chat now with support
Chat with Support

Foglight Hybrid Cloud Manager 6.0.0 - User Guide (for AWS environments)

Using Foglight Hybrid Cloud Manager for AWS Monitoring Tab System Info Tab Tags Tab Report Tab Rule Configuration Tab Administration Tab Optimizer Tab Cost Tab Policy Management Tab

Region Summary view

The Region Summary view appears on the right when you select a region in the Regions view.

Figure 10. Region Summary view

This view consists of the following embedded views:

Table 4. Alarms

Lists the alarms generated against the selected virtual machine.

Alarm Message. An explanation about why the alarm occurred.
Severity. Indicates the alarm severity: Warning, Critical, or Fatal.
Time. Indicates when the alarm occurred.

Drill down on:

Alarm Message, Severity, or Time. Displays the Alarm Created dialog box, showing additional information about the alarm. For more information about alarms, see the Foglight User Help.
Table 5. Related Items

Shows the numbers and states of the selected regions.

EC2 Instances. The number of the ECS2 instances that are associated with the selected region, followed by related alarm counts, broken down by the alarm state (Normal, Warning, Critical, Fatal).
EBSs. The number of the EBSs that are associated with the selected region, followed by related alarm counts, broken down by the alarm state (Normal, Warning, Critical, Fatal).
Accounts. The number of the accounts that are that are associated with the selected region, followed by related alarm counts, broken down by the alarm state (Normal, Warning, Critical, Fatal).

Drill down on:

EC2 Instances. Displays the EC2 Instances Inventory dwell, showing the name and state of the associated Resource Groups.
EBSs. Displays the EBS Inventory dwell, showing the name and state of the associated virtual machine.
Accounts. Displays the Other Items Inventory dwell, showing the name and state of the associated accounts.

Shows a table, showing the information about the resource utilization associated with the selected region.

Disk Usage. Indicates total Disk Usage throughput across all EC2 Instances monitored by the Region.
Network I/O. Indicates total network throughput across all EC2 Instances monitored by the Region.
CPU Load. Shows the average CPU Load on all EC2 Instances for the Region based on the total capacity.
Memory. Shows the Memory Utilization summary for the specified Region based on the total capacity.

Drill down on:

CPU Load. Displays the CPU Load dialog box, including CPU Utilization and Baseline.
Memory. Displays the Memory Usage dialog box, including Memory Utilization and Baseline.
Network I/O. Displays the Network I/O view, showing the metrics of network Usage (in bps) and Baseline.
Disk Usage. Display the Disk Usage view, showing the metrics of disk Usage and Baseline.

Region Explore view

The Region Explore view opens when you click Explore in the Region Summary view.

This view consists of the following embedded views:

Shows region basic information, include endpoints, instances, volumes, and auto scaling groups.

Shows the state of the availability zones.

Table 9. Top Consumers

Show the top 3 consumers at this region.

Top Instances - CPU Used Hz. Indicates top 3 CPU Usage at this region.
Top Volumes - Throughput. Indicates top 3 volume throughput at this region.
Top Instances - Network Transfer Rate. Indicates top 3 network transfer rate at this region.

Drill down on:


Table 10. Health Events

Shows health events belong to this region, include the event name, start time, event type, and so on.

Account monitoring

The Accounts view shows the data collected about a specific account created by IAM users. For more information, see the following topics:

Accounts view

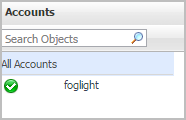
The Accounts tree view lists the account existing in your AWS environment and shows their state. This view appears on the left when you select the Accounts tile in the Actions bar.

Figure 12. Accounts view

Selecting the All Accounts node displays overall resource utilization for all accounts in your AWS environment and the elements that consume the highest amount of system resources in the Summary - All Accounts view on the right. Similarly, selecting an account node shows account-specific metrics in the Account Summary view on the right.

Alarm severity. The state of the most recent alarm raised against the associated account.
All Accounts. A parent node for the account object instances that appear in this view.
Account. The account name.

Drill down on:

All Accounts. Shows the Summary - All Accounts view on the right.
Account. Shows the Account Summary view on the right.
Related Documents

The document was helpful.

Select Rating

I easily found the information I needed.

Select Rating