|
1 |
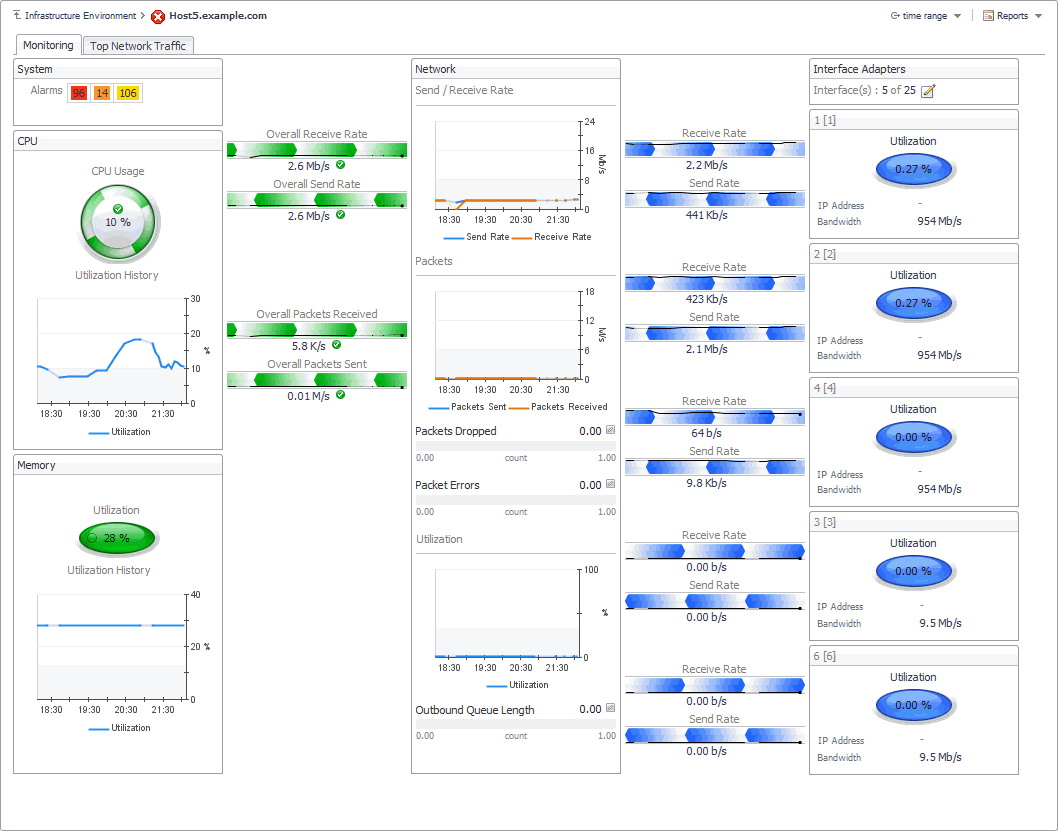
On the Infrastructure Environment dashboard, select the Network, Firewall, Switch, or Router service, and then click the Firewall, Switch, or Router tile. |
|
2 |
In the Quick View, in the Firewalls, Switches, or Routers view, ensure that All Switches, All Routers, or All Firewalls are selected. |
|
3 |
In the Summary - All Switches, Summary - All Routers, or Summary - All Firewalls view, select a device. |
|
4 |
|
• |
|
• |
|
• |
|
• |
| |||
Figure 29. Utilization dwell
 |
| |||
| |||
| |||
| |||
| |||
| |||
| |||
|
| |||
| |||
| |||
|
Allows you to select up to five network interfaces and display their statistics on the Monitoring tab, in individual Interface Adapter views. | |||
Figure 30. Select interfaces to display dialog box
 The Select interfaces to display dialog box lists the available network interfaces and allows you to select them, as required. You also have an option to select the top five interfaces with the highest network utilization. For each interface, the list shows its name, IP address, MAC address, network utilization, and bandwidth. |
| |||
Figure 31. Utilization dwell
|
|
Displays the network data related to the monitored device, organized into several simple charts and counters: Send/Receive Rate, Packets, Packets Dropped, Packet Errors, Utilization, and Outbound Queue Length. | |||
| |||
| |||
| |||
Figure 32. Packets dwell
 | |||
Figure 33. Packets dwell
| |||
Figure 34. Send/Receive Rate dwell
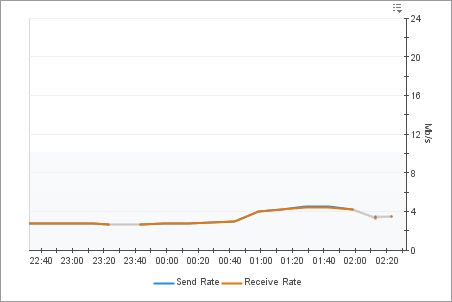 | |||
Figure 35. Send/Receive Rate dwell
| |||
Figure 36. Utilization dwell
|
Figure 37. Outstanding Alarm(s) dialog box
 |
|
1 |
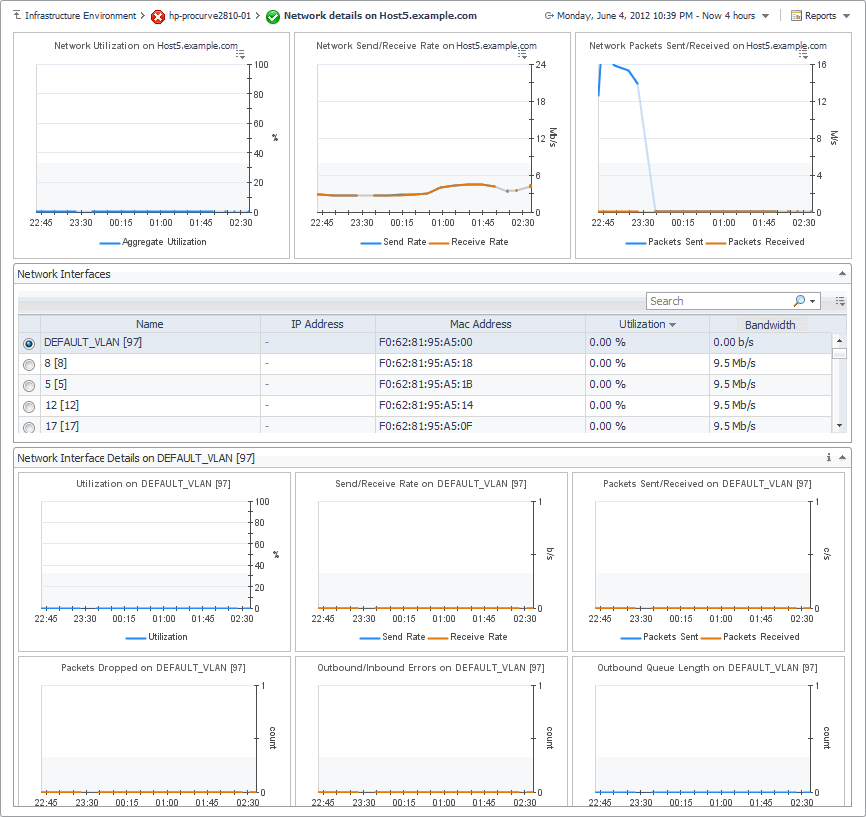
On the Infrastructure Environment dashboard, select the Network, Firewall, Switch, or Router service, and then click the Switch or Router tile. |
|
2 |
In the Quick View, in the Switch or Router view (see page 55 for more information), ensure that All Switches, All Routers, or All Firewalls is selected. |
|
3 |
In the Summary - All Switches, Summary - All Routers, or Summary - All Firewalls view, select a device. |
|
4 |
|
Displays network data related to the monitored device, organized into six simple charts: Utilization, Send/Receive Rate, Packets Sent/Received, Packets Dropped, Outbound/Inbound Errors, and Outbound Queue Length. | |||
| |||
| |||
| |||
| |||
| |||
| |||
| |||
| |||
| |||
|
| |||
| |||
| |||
| |||
|
| |||
|
| |||
|
|
|
1 |
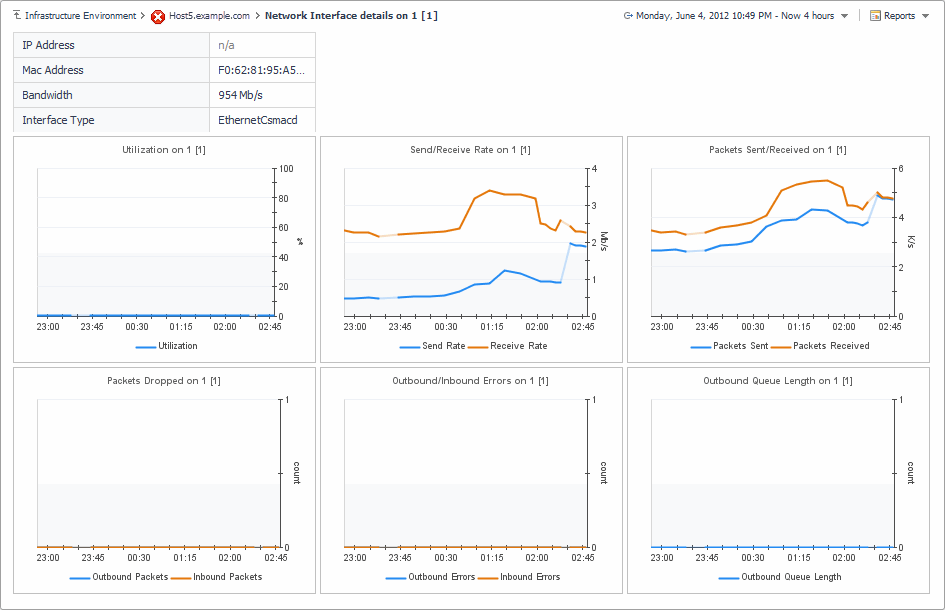
On the Infrastructure Environment dashboard, select the Network, Firewall, Switch, or Router service, and then click the Switch, Router, or Firewall tile. |
|
2 |
In the Quick View, in the Switch, Router, or Firewall view (see page 55 for more information), ensure that All Switches, All Routers, or All Firewalls is selected. |
|
3 |
In the Summary - All Switches, Summary - All Routers, or Summary - All Firewalls view, select a device. |
|
4 |
|
5 |
Click any of the interface-specific Receive Rate or Send Rate flows to display additional details about the selected network interface. |
| |||
| |||
| |||
|
| |||
|
|
| |||
|
| |||
|
| |||
|
|
|
1 |
On the Infrastructure Environment dashboard, select the Network, Firewall, Switch, or Router service, and then click the Switch, Router, or Firewall tile. |
|
2 |
In the Quick View, in the Switch, Router, or Firewall view (see page 55 for more information), ensure that All Switches, All Routers, or All Firewalls is selected. |
|
3 |
In the Summary - All Switches, Summary - All Routers, or Summary - All Firewalls view, select a device. |
|
4 |
|
5 |
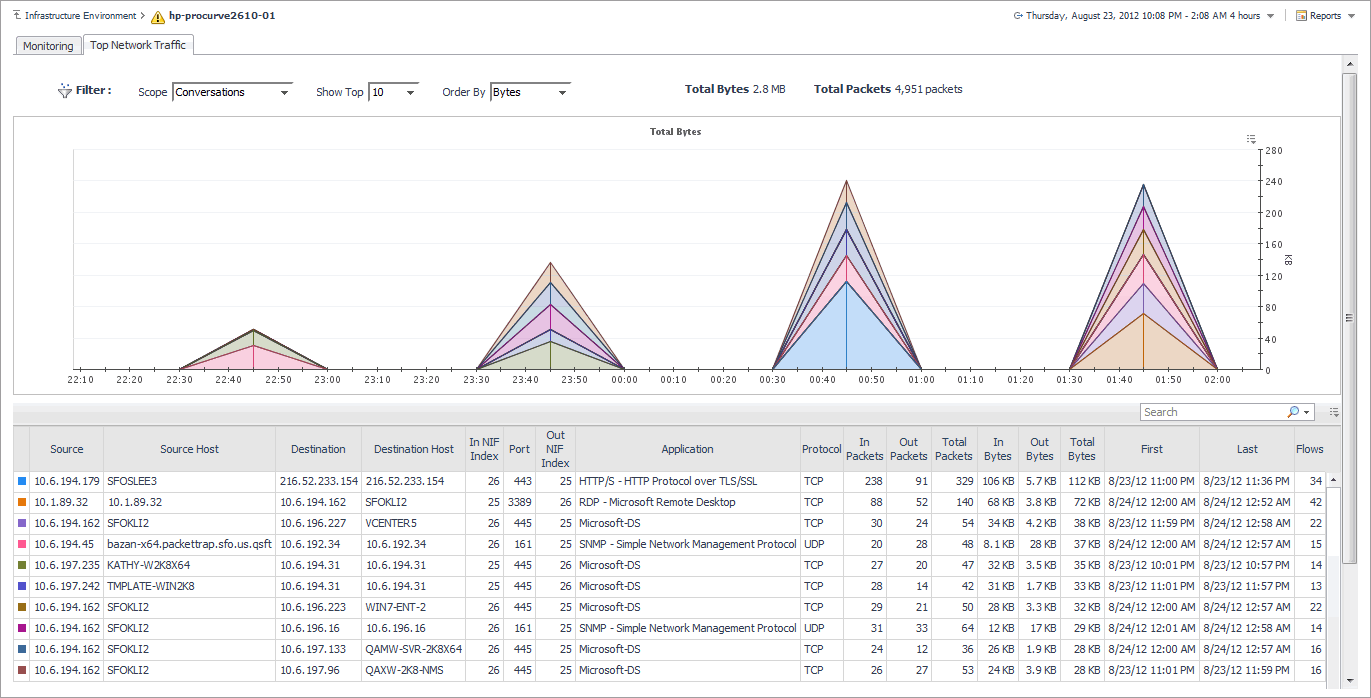
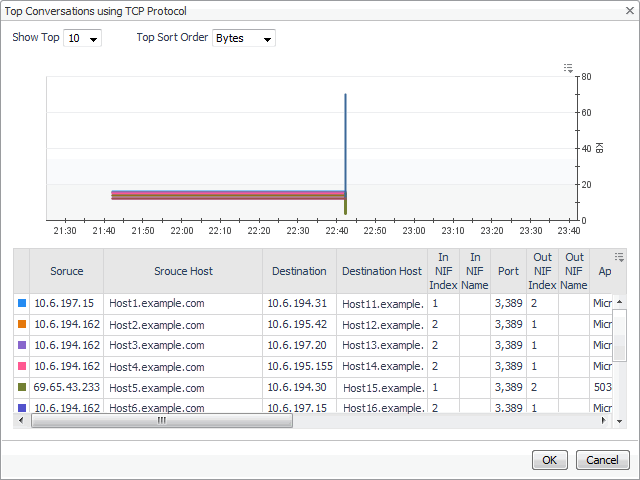
Open the Top Network Traffic tab. |
| |||
| |||
| |||
| |||
| |||
| |||
| |||
| |||
| |||
|
| |||
| |||
| |||
| |||
| |||
| |||
| |||
| |||
| |||
| |||
 |
| |||
| |||
| |||
| |||
| |||
| |||
| |||
| |||
| |||
| |||
| |||
| |||
| |||
| |||
| |||
| |||
| |||
| |||
| |||
| |||
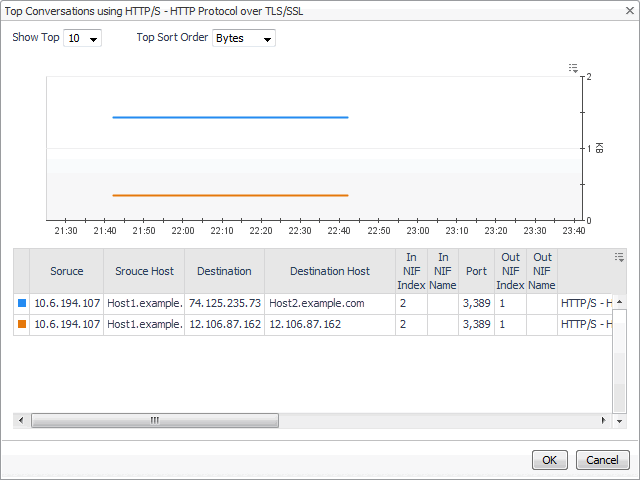
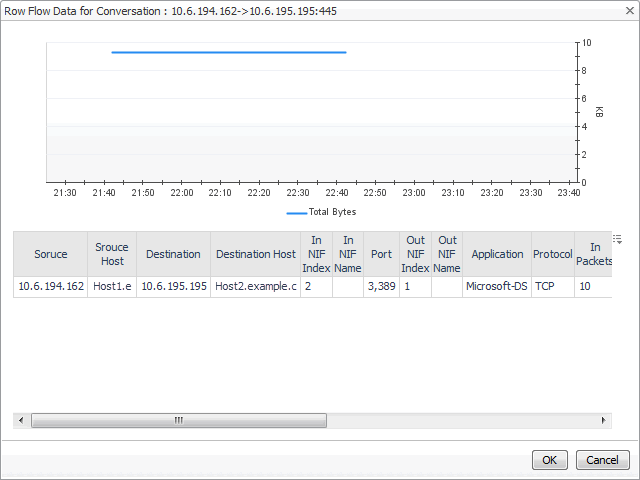
Figure 40. Row Flow Data for Conversion dialog box
 |
| |||
| |||
| |||
| |||
| |||
| |||
| |||
|
| |||
| |||
| |||
| |||
| |||
| |||
| |||
|
| |||
| |||
| |||
| |||
| |||
| |||
| |||
| |||
|
| |||
| |||
| |||
| |||
| |||
| |||
| |||
| |||
 |
