Chat now with support
Chat with Support

Foglight for Hyper-V 6.1.0 - User Guide

About Hyper-V Monitoring in Foglight Evolve Cloud Agent administration Performance monitoring with the Hyper-V Environment dashboard Performance investigation with the Hyper-V Explorer Hyper-V Monitoring in Foglight Evolve Cloud alarms Appendix: Hyper-V Agent error codes

Hyper-V Explorer Summary (All Servers) tab

The Hyper-V Explorer Summary (All Servers) tab shows a summary of system resources for all physical servers that currently exist in your integrated infrastructure.

This tab appears in the Hyper-V Explorer when you select the Servers node on the Hyper-V Explorer Topology tab.

Shows the combined percentage of the CPU usage for all servers in the system.

Combined CPU Consumption %. The combined percentage of the CPU utilization used by all servers to execute system code and user programs during the selected time period.

Drill down on:

Combined CPU Consumption %. Displays the Combined CPU Consumption dialog box.
Figure 37. Combined CPU Consumption dialog box

This tabular view lists all servers that exist in your environment.

Server, CPU. The current amount of the CPU speed that is used by the server.
Server, Key. The color used in the Combined CPU Consumption chart to represent the server.
Server, Memory. The current percentage of memory that is used by the server.
Server, NICs. The number of network interface cards used by the server.
Server, Server Name. Server name.
Server, Status. The server status, associated with any alarms raised against it. If no alarms are fired, the status appears as Normal. Otherwise, the status is set to the highest alarm severity (Warning, Critical, or Fatal).
Server, Version. The version number of the Windows OS running on the server.
Virtual Machines, Configured. The number of virtual machines that exist on the server.
Virtual Machines, Running. The number of virtual machines that are running on the server.

Drill down on any server entry. The Hyper-V Environment dashboard appears, showing the server details on the Hyper-V Explorer Summary tab.

The Hyper-V Explorer’s Virtual Environment view displays a high-level overview of your virtual environment. The view has a tile for each type of object in your virtual infrastructure: Clusters, Servers, and Virtual Machines. Each tile shows how many of the corresponding object instances there are in your virtual infrastructure, as well as the count of objects of that type in each of the alarm states (Normal, Warning, Critical, Fatal).

Alarm counts. The total counts of alarms associated with the clusters, servers, or virtual machines, broken down by alarm types (Normal, Warning, Critical, Fatal).
Cluster count. The number of physical servers in your virtual environment.
Server count. The number of physical servers in your virtual environment.
Virtual Machine count. The number of virtual machines in your environment.

Drill down on:

Clusters. Displays the Clusters dwell, showing the names and states of all clusters in your environment.
Figure 38. Clusters dwell
Servers. Displays the Servers dwell, showing the name and state of all servers in your environment.
Figure 39. Servers dwell
Virtual Machines. Displays the Virtual Machines dwell, showing the names and states of all virtual machines in your environment.
Figure 40. Virtual Machines dwell

Hyper-V Explorer Summary (All Virtual Machines) tab

The Hyper-V Explorer Summary (All Virtual Machines) tab shows a summary of system resources for all virtual machines that currently exist in your integrated infrastructure.

This tab appears in the Hyper-V Explorer when you select the Virtual Machines node on the Hyper-V Explorer Topology tab.

This tab is made up of the following embedded views:

The Hyper-V Explorer’s Virtual Environment view displays a high-level overview of your virtual environment. The view has a tile for each type of object in your virtual infrastructure: Clusters, Servers, and Virtual Machines. Each tile shows how many of the corresponding object instances there are in your virtual infrastructure, as well as the count of objects of that type in each of the alarm states (Normal, Warning, Critical, Fatal).

Alarm counts. The total counts of alarms associated with the clusters, servers, or virtual machines, broken down by alarm types (Normal, Warning, Critical, Fatal).
Cluster count. The number of physical servers in your virtual environment.
Server count. The number of physical servers in your virtual environment.
Virtual Machine count. The number of virtual machines in your environment.

Drill down on:

Clusters. Displays the Clusters dwell, showing the name and state of all clusters in your environment.
Figure 42. Clusters dwell
Servers. Displays the Servers dwell, showing the name and state of all servers in your environment.
Figure 43. Servers dwell
Virtual Machines. Displays the Virtual Machines dwell, showing the names and states of all virtual machines in your environment.
Figure 44. Virtual Machines dwell

This tabular view lists all virtual machines that exist in your environment.

Server, Name. The name of the server on which the virtual machine is running.
Server, Status. The status of the server on which the virtual machine is running, associated with any alarms raised against it. If no alarms are fired, the status appears as Normal. Otherwise, the status is set to the highest alarm severity (Warning, Critical, or Fatal).
Virtual Machine, CPU Utilization. The percentage of the virtual machine’s CPU utilization spent on executing system code and user programs.
Virtual Machine, Name. The virtual machine name.
Virtual Machine, Status. The virtual machine status, associated with any alarms raised against it. If no alarms are fired, the status appears as Normal. Otherwise, the status is set to the highest alarm severity (Warning, Critical, or Fatal).
Virtual Machine, Total Memory. The total amount of memory allocated to the virtual machine.

Drill down on any virtual machine entry. The Hyper-V Environment dashboard appears, showing the server details on the Hyper-V Explorer Summary tab.

Hyper-V Explorer VMs

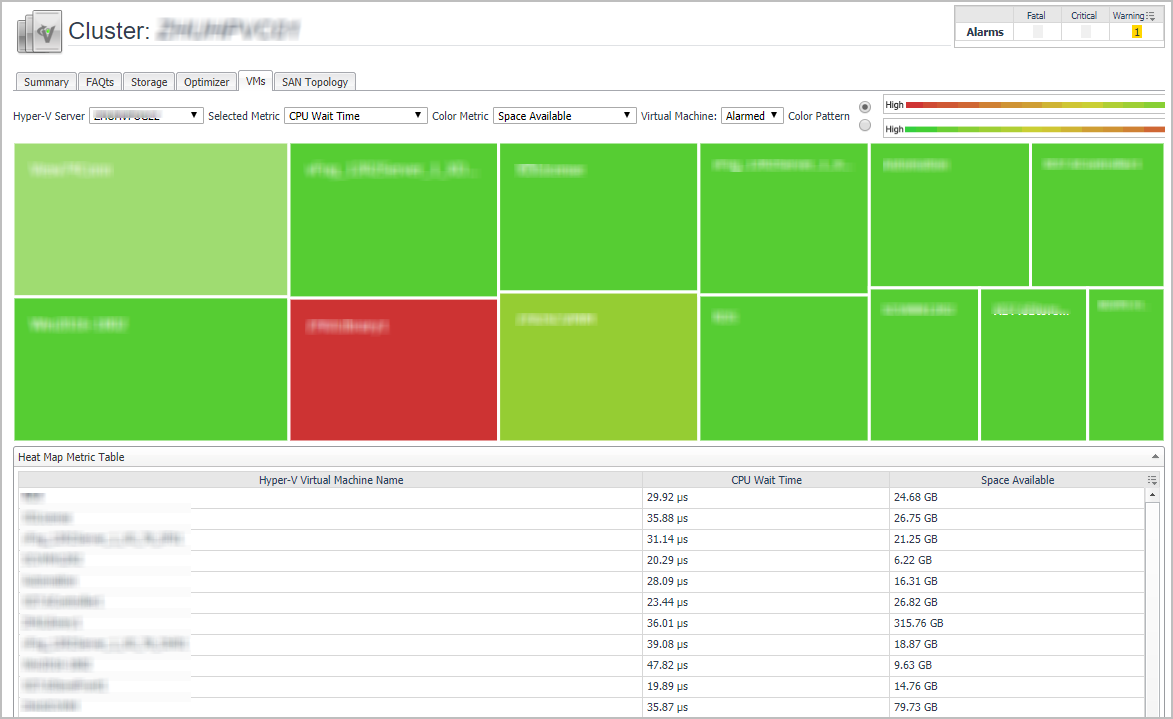
The Hyper-V Explorer VMs tab appears when you are exploring individual clusters. The VMs tab is consisted by a Heat Map Chart: and a Metric Table:.

Figure 45. VMs tab

Hyper-V Explorer Monitor

The Hyper-V Explorer Monitor tab appears when you are exploring individual servers and virtual machines. It provides more details about the component’s resource usage, such as the utilization of each individual CPU, server, and cluster performance, and the data throughput rate.

Figure 46. Monitor tab

Related Documents

The document was helpful.

Select Rating

I easily found the information I needed.

Select Rating