|
1 |
|
2 |
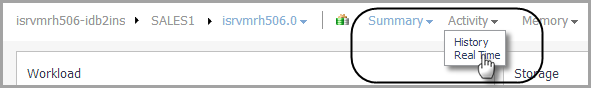
The following summary and drill-downs pages are provided:
|
• |
|
• |
Activity Drill-downs (links to description under Database home page) |
|
• |
Memory Drill-downs (links to description under Database home page) |
|
• |
Storage Drill-downs (links to description under Database home page) |
|
• |
Log Drill-down (links to description under Database home page) |
|
• |
Configuration Drill-down (links to description under Database home page) |
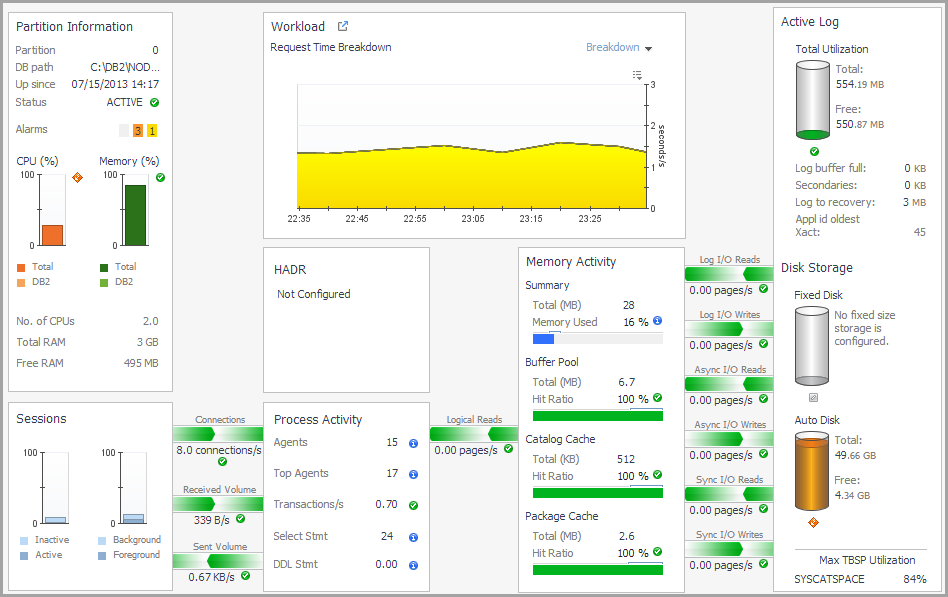
This home page contains the following panes:
|
• |
| |||
| |||
| |||
|
Clicking the Investigate using the “Top SQL” drilldown link takes you to the Top SQL pane for additional information. |
| |||
| |||
| |||
|
Clicking the Investigate using the “Table Space” drilldown link takes you to the Tablespaces pane for additional information. |
| |||
| |||
| |||
|
Clicking any of the three charts displays a pop-up that provides additional, related information. On the pop-up, clicking the Investigate using the “Host Monitor” drilldown link takes you to the Host Monitor dashboard for additional information. |
| |||
| |||
| |||
| |||
| |||
| |||
| |||
If the database is configured for HADR, the HADR pane displays the associated HADR metrics for the partition. It is at the bottom right of the Partition (History) home page. For more information on these parameters, see HADR Activity Collection .
| |||
| |||
| |||
| |||
| |||
|
Clicking the icon next to a metric displays a pop-up with additional, related information. |
|
1 |
|
2 |
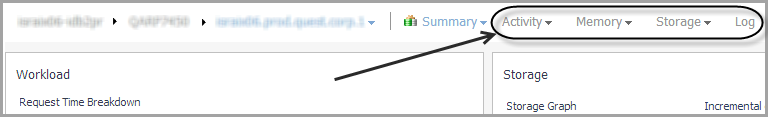
The following summary and drill-downs pages are provided:
|
• |
|
• |
Activity Drill-downs (links to description under Database home page) |
|
• |
Memory Drill-downs (links to description under Database home page) |
|
• |
Storage Drill-downs (links to description under Database home page) |
|
• |
Log Drill-down (links to description under Database home page) |
|
• |
Configuration Drill-down (links to description under Database home page) |