Chat now with support
Chat with Support

Foglight for DB2 (Cartridge) 5.9.3.10 - User Guide

Introduction to Foglight for DB2 LUW Using Foglight for DB2 LUW Reference
Dashboards and Views Collections and Metrics
CF Locks Collection CF Memory Pools Collection CF Resource Usage Collection Current Agents Details Collection Agents Summary Collection Current Locks Wait Collection Database Bufferpools Summary PS Collection Database Configuration Collection Database Tablespaces Collection Database Tablespaces Summary Collection Database Usability Collection Database Parameters Collection Database Instance Parameters Collection Database Instance Registry Variables Collection Database Tablespaces BP Collection FCM Activity Collection FS DB Storage Collection FS DB Storage Summary Collection FS Instance Storage Collection FS Storage Collection FS Storage Summary Collection General Activity Collection HADR Activity Collection Host Properties Collection OS General Collection Instance Activity Collection Instance General Collection Instance Nodes Collection Instance Usability Collection IO Activity Collection License Details Collection Log Activity Collection Log File Collection Log Message Collection Messages Count Collection Monitor Switches Collection OS DB2 General Process Collection Partition Tablespaces Summary Collection Partition Usability Collection pureScale Alerts Collection Top SQLs Collection Top SQLs Full Text Collection Top SQLs Text Collection Query Agents Details Collection Database Partition Activity Collection DB2 Partition Subcategories Wait Collection History Locks Wait Collection History Locks Summary Collection Instance Memory Collection Instance Memory Pool Collection Instance Memory Summary Collection Instance Memory Total Collection Database Memory Collection Database Memory Pool Collection Database Memory Pool DB Collection Database Memory Summary Collection Database Memory Total Collection Database Buffer Pools Collection Database Tables Collection Database Partition Backup Collection Database Tables Global Collection Database Applications Collection

Tablespaces Buffer Pool Activities

Provides the metrics required to monitor tablespace buffer pool activities and can be sorted according to the buffer pool hit ratio.

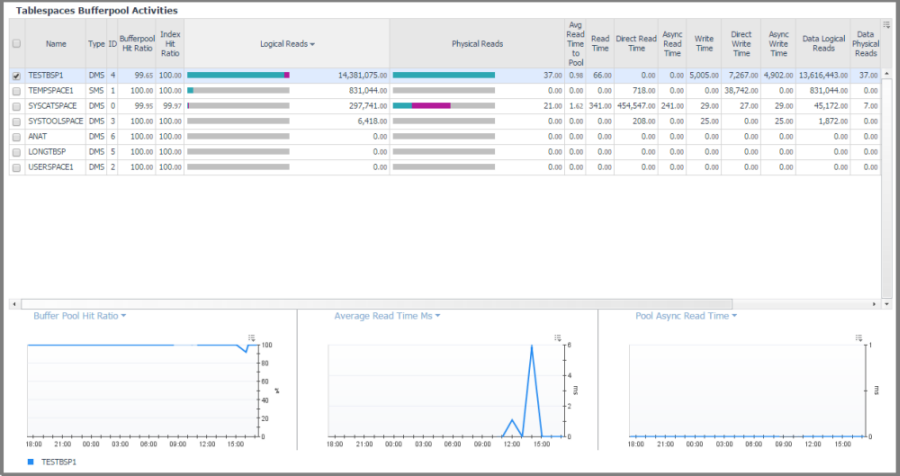
On the Database home page toolbar, click Storage and select Tablespaces Bufferpool Activities.

This pane provides the Tablespaces Bufferpool Activities view.

Displays the top tablespaces buffer pool activities metrics and allows you to choose the tablespace to plot and view charts on the details and performance of the selected tablespace. The tablespaces are sorted according to the buffer pool hit ratio.

Async Read Time. The time (in milliseconds) spent on reading data pages by database manager prefetchers.
Async Write Time. The time (in milliseconds) spent on writing data or index pages by database manager prefetchers.
Bufferpool Hit Ratio. The percentage of read requests that are satisfied by the buffer pool without having to physically read from the disk.
Data Logical Reads. The number of logical read requests for data pages that go through the buffer pool.
Data Physical Reads. The number of physical (disk) read requests for data pages that do not go through the buffer pool.
Data Writes. The number of data writes.
Direct Read Time. The time (in milliseconds) spent on performing direct reads.
Direct Write Time. The time (in milliseconds) spent on performing direct writes.
Index Hit Ratio. The percentage of read requests for index pages that are satisfied without having to read from the disk.
Index Logical Reads. The number of logical read requests for index pages that are satisfied without having to read from disk.
Index Physical Reads. The number of physical (disk) read requests for index pages that need to read data from disk.
Index Writes. The number of index writes.
Name. The tablespace name.
Read Time. The amount of elapsed time (in milliseconds) spent on processing read requests.
Type. The tablespace type (DMS Database-Managed Space) or SMS (System-Managed Space).
Write Time. The amount of elapsed time (in milliseconds) spent on processing write requests.
Total logical reads. Total pages read from the bufferpool. count all page types : data, index, XDA and column-organized .
Total physical reads. Total pages read from the table space containers (physical) to the pool. Count all page types : data, index, XDA and column-organized.
Col logical Reads. Total number of column-organized pages requested from the buffer pool (logical).
Col Physical Reads. Total number of column-organized pages read in from the table space containers (physical).
Col Hit Ratio. Percentage of column-organized pages reads that were carried out from the buffer pool for the selected tablespace, without having to perform physical reads.
GBP Logical Reads. The number of pages read from the Group Buffer Pool (GBP) because the page was either invalid or not present in the Local Buffer Pool (LBP). Only relevant for a puresclae instance.
GBP physical reads. The number of Group Buffer Pool (GBP) dependent pages that were read into the local buffer pool from disk because it was not found in the GBP.
GBP Hit Ratio. The percent of time a requested page was found in the group bufferpool out of all times it was requested. If a page is found in the GBP it saves the database the time to look for it in the Local Buffer Pool. Only relevant for a puresclae instance.
Avg Read Time to Pool. The average time it takes to read a single page from the table space containers (physical) to the buffer pool. value is given in milliseconds.

One or more tablespace entries can be viewed by selecting them in the table. The graphs in the lower pane sho the information for the selected tablespaces.

Log Drill-down

The Log drill-down provides a diagnostic graph and log of database log activity. Records displayed are those configured in the Diagnostic Log administration screen.

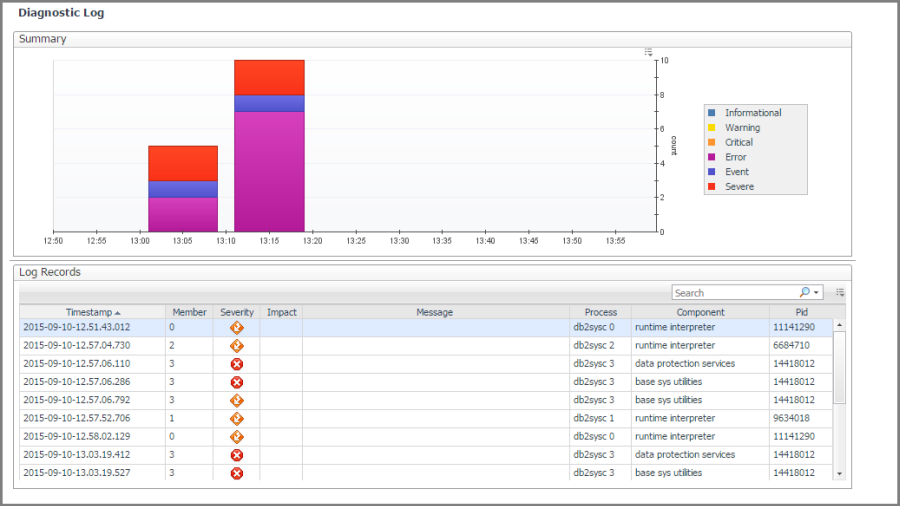
On the Database home page toolbar, click Log.

This pane provides the following views:

Displays a graphical history of the informational, warning, critical, error and other counts graphed over a period.


Displays information log table messages in tabular form.


Timestamp. The exact time and date when the message log was created.
Member. Member where the message came from.
MSGNUM. Message number
Severity. Severity of the message.
Type. Message type.
Message. Text of the message.
Pid. Process ID.
Process. Which DB2 process triggered the message.
TID. Timestamp identification number.
Application ID. Identifies the application from which the message originated.

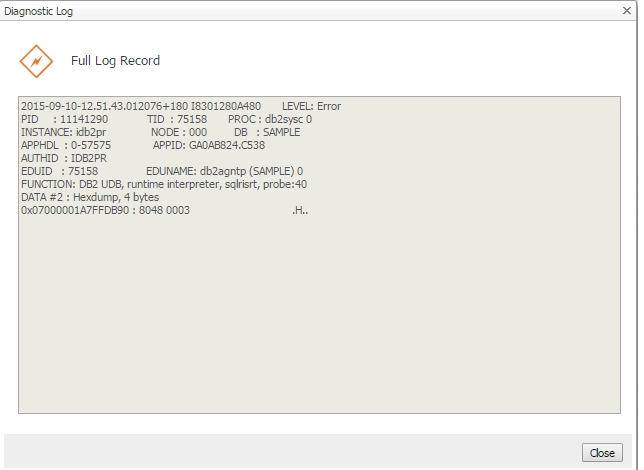
Selecting any record will open a pop-up with the full log record.

Configuration Drill-down

The Configuration drill-down provides the list of initialization parameters with their current values and other pertinent information, sorted in alphabetical order.

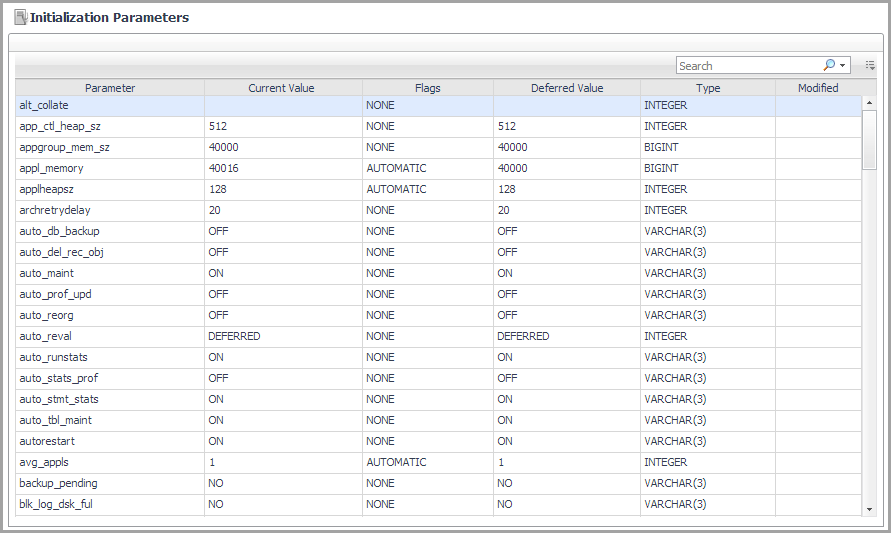
On the Database home page toolbar, click Configuration.

This pane provides the Initialization Parameters view.

Displays the list of initialization parameters with their current values and other pertinent information, sorted in alphabetical order.

Parameter. The initialization parameter name.
Current Value. The current value of the initialization parameter.
Flags. Whether the initialization parameter is flagged as AUTOMATIC.
Deferred Value. The deferred value of the initialization parameter. If a non-AUTOMATIC parameter was changed and the database has not yet been recycled, the deferred value may be different than the current value.
Type. The type of value for the initialization parameter.
Modified. Whether the initialization parameter has been modified.

Clicking any table cell displays the change history for the corresponding initialization parameter.

Member (History) home page

This home page provides metrics on the state of the member over the course of the selected time range. Pop-ups provide graphs that show you how the member is performing and whether there are any critical areas that need to be addressed.

The metrics provided on this home page are different for DB2 v9.7.0.1 and later than they are for DB2 databases earlier than v9.7.0.1. For more information, see below.

NOTE:  
Related Documents

The document was helpful.

Select Rating

I easily found the information I needed.

Select Rating