Tchater maintenant avec le support
Tchattez avec un ingénieur du support

Foglight for DB2 (Cartridge) 5.9.3.10 - User Guide

Introduction to Foglight for DB2 LUW Using Foglight for DB2 LUW Reference
Dashboards and Views Collections and Metrics
CF Locks Collection CF Memory Pools Collection CF Resource Usage Collection Current Agents Details Collection Agents Summary Collection Current Locks Wait Collection Database Bufferpools Summary PS Collection Database Configuration Collection Database Tablespaces Collection Database Tablespaces Summary Collection Database Usability Collection Database Parameters Collection Database Instance Parameters Collection Database Instance Registry Variables Collection Database Tablespaces BP Collection FCM Activity Collection FS DB Storage Collection FS DB Storage Summary Collection FS Instance Storage Collection FS Storage Collection FS Storage Summary Collection General Activity Collection HADR Activity Collection Host Properties Collection OS General Collection Instance Activity Collection Instance General Collection Instance Nodes Collection Instance Usability Collection IO Activity Collection License Details Collection Log Activity Collection Log File Collection Log Message Collection Messages Count Collection Monitor Switches Collection OS DB2 General Process Collection Partition Tablespaces Summary Collection Partition Usability Collection pureScale Alerts Collection Top SQLs Collection Top SQLs Full Text Collection Top SQLs Text Collection Query Agents Details Collection Database Partition Activity Collection DB2 Partition Subcategories Wait Collection History Locks Wait Collection History Locks Summary Collection Instance Memory Collection Instance Memory Pool Collection Instance Memory Summary Collection Instance Memory Total Collection Database Memory Collection Database Memory Pool Collection Database Memory Pool DB Collection Database Memory Summary Collection Database Memory Total Collection Database Buffer Pools Collection Database Tables Collection Database Partition Backup Collection Database Tables Global Collection Database Applications Collection

How to Get Here

1
From the Database home page, click Whole Database and select the member you want.
2
Click Summary and select Overview.

The following summary and drill-downs pages are provided:

Activity Drill-downs (links to description under Database home page)
Memory Drill-downs (links to description under Database home page)
Storage Drill-downs (links to description under Database home page)
Log Drill-down (links to description under Database home page)
Configuration Drill-down (links to description under Database home page)

Summary

This home page contains the following panes:

The Workload pane displays the session activity and CPU usage information for the selected partition. It is at the upper left of the Partition (History) home page.

CPU Wait Time. The average CPU wait time (in milliseconds), plotted over the course of the selected time range.
Average Active Sessions. A comparison of the average number of active sessions over the course of the selected time range with the average number of active sessions expected (according to the baseline).
CPU Usage. The percentage of CPU used by the partition, plotted over the course of the selected time range.

Mousing over a data point on either of the charts displays a pop-up that provides more detailed information about the data point.

Clicking the Investigate using the “Top SQL” drilldown link takes you to the Top SQL pane for additional information.

The Storage pane displays the storage information for the selected partition. It is at the upper right of the Partition (History) home page.

Storage Graph. The storage activity of the partition plotted over the course of the selected time range.

The storage can be plotted as either:

Avg. Consumption (MB/hour). The average storage space consumed (in MB/hour) over the course of the selected time range.
Total Allocated (MB). The total storage space allocated (in MB).

Mousing over a data point on the plot displays a pop-up that provides more detailed information about the data point.

Clicking the Investigate using the “Table Space” drilldown link takes you to the Tablespaces pane for additional information.

The OS Performance pane displays the OS performance information for the selected partition. It is at the bottom left of the Partition (History) home page.

Avg. CPU (%). The average CPU consumed, as a percentage of the total allocated, over the course of the selected time range.
Avg. Memory (%). The average memory consumed, as a percentage of the total allocated, over the course of the selected time range.
Disk Utilization (%). The disk utilization, as a percentage of the total allocated, over the course of the selected time range.

Clicking any of the three charts displays a pop-up that provides additional, related information.

On the pop-up, clicking the Investigate using the “Host Monitor” drilldown link takes you to the Host Monitor dashboard for additional information.

The Availability pane displays the availability information for the selected partition. It is at the lower middle of the Partition (History) home page.

Sessions. The availability of the active and inactive sessions plotted over the course of the selected time range.
Member Availability. The average availability of the partition over the course of the selected time range.
Average Request Time (ms). The average length of time (in ms) it took to process a single request, over the course of the selected time range.
Transaction Rate. The number of transactions being processed per second.

Mousing over a data point on the Sessions chart displays a pop-up that provides more detailed information about the data point.

Clicking anywhere on the Partition Availability chart displays a pop-up that provides additional, related information.

Clicking the icon next to the Avg. Request Time or Transaction Rate metric displays a pop-up that provides additional, related information.

The Cache Hit Ratio pane displays the cache hit ratio information for the selected partition. It is at the right of the Partition (History) home page.

Buffer Pool (%). The percentage of database page I/O requests that were satisfied using the buffer cache (and therefore the database did not have to perform disk reads), over the course of the selected time range.
Package (%). The number of times that a requested section was not available for use and had to be loaded into the package cache, as a percentage of the total number of times that a section was requested, over the course of the selected time range.
Catalog (%). The number of times that a table descriptor or authorization information was not found in the catalog cache and had to be inserted there, as a percentage of the total number of times that a table descriptor or authorization information was requested, over the course of the selected time range.

Clicking the icon next to any of the cache hit ratios displays a pop-up that provides additional, related information.

Clicking the link at the bottom of any of the three pop-ups takes you to the corresponding dashboard for additional information.

If the database is configured for HADR, the HADR pane displays the associated HADR metrics for the partition. It is at the bottom right of the Partition (History) home page. For more information on these parameters, see HADR Activity Collection .

Role. The HADR role of the database.
HADR Remote Host. The name of the HADR remote host.
HADR Remote Instance. The name of the HADR remote instance.
Log Gap. The size (in KB) of the gap between the primary log sequence number and the standby log sequence number.
HADR State. The HADR state of the database:

Clicking the icon next to a metric displays a pop-up with additional, related information.

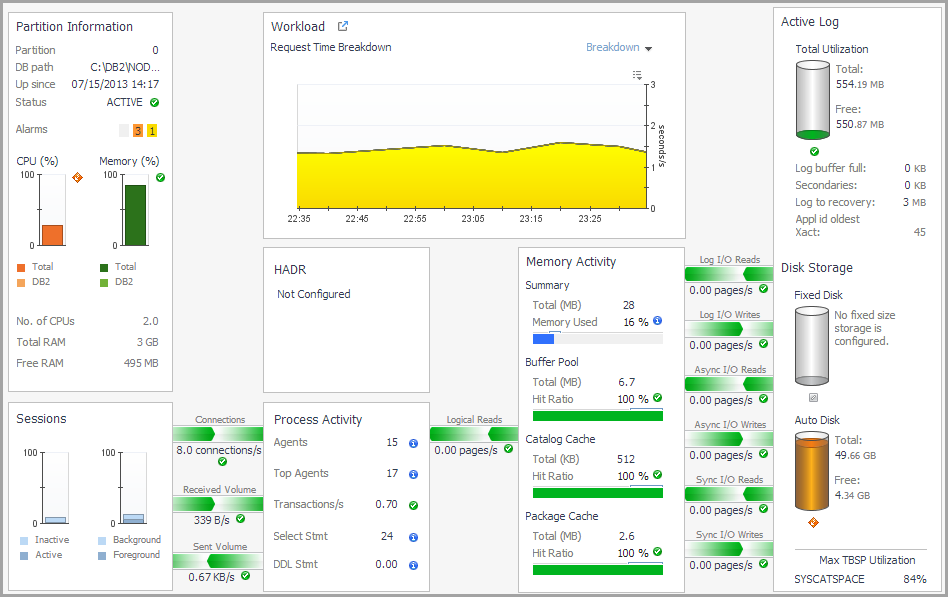
Member (Real Time) home page

This home page provides metrics on the current state of the selected partition. It allows you to view how the partition is performing and any performance or bottleneck issues affecting the partition. Pop-ups provide additional information and graphs.

How to Get Here

1
From the Database home page, click Whole Database and select the partition you want.
2
Click Summary and select Real Time.

The following summary and drill-downs pages are provided:

Activity Drill-downs (links to description under Database home page)
Memory Drill-downs (links to description under Database home page)
Storage Drill-downs (links to description under Database home page)
Log Drill-down (links to description under Database home page)
Configuration Drill-down (links to description under Database home page)
Documents connexes

The document was helpful.

Sélectionner une évaluation

I easily found the information I needed.

Sélectionner une évaluation