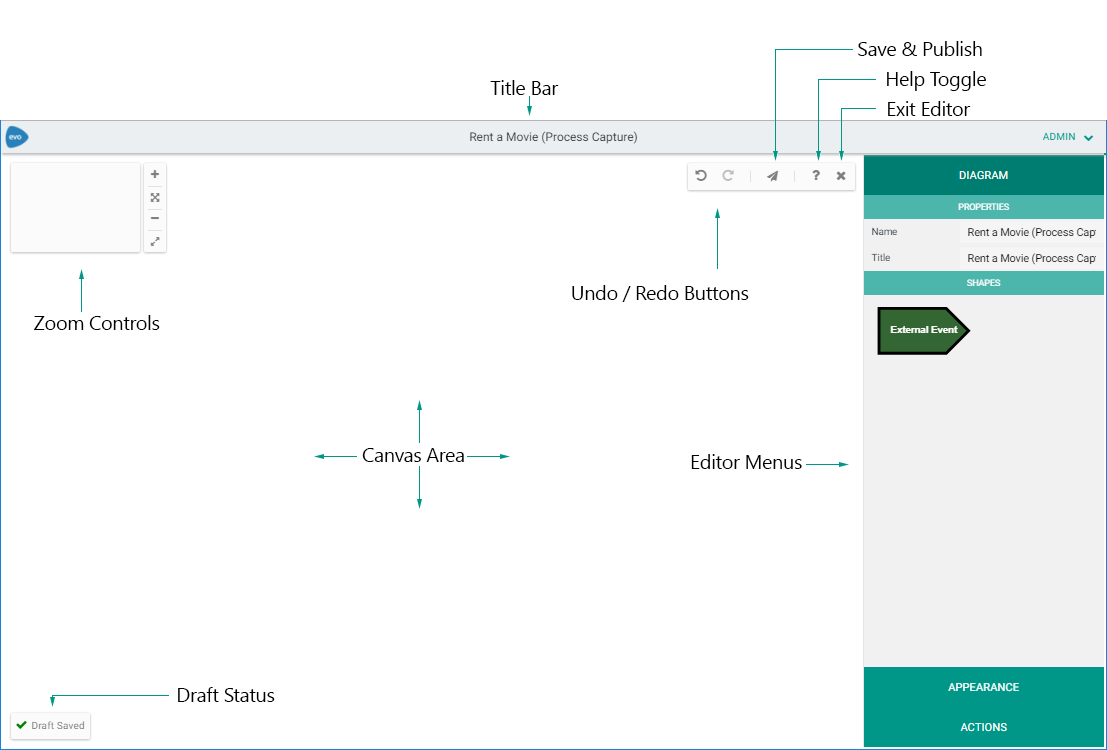
Editing Business Process Diagrams
|
|
Please check with your Administrator that firstly, your Server and Internet Browser meet the necessary system requirements to use BP modeler. Secondly, check with your Administrator that the eModeler feature is enabled. |
BP modeler is used to both edit and create Process Diagrams online, using predefined Dynamic Templates and Themes.
The different features within the Editor are detailed below:
|
Title Bar |
Displays the Diagram Draft and related Template Names |
|
|
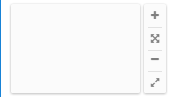
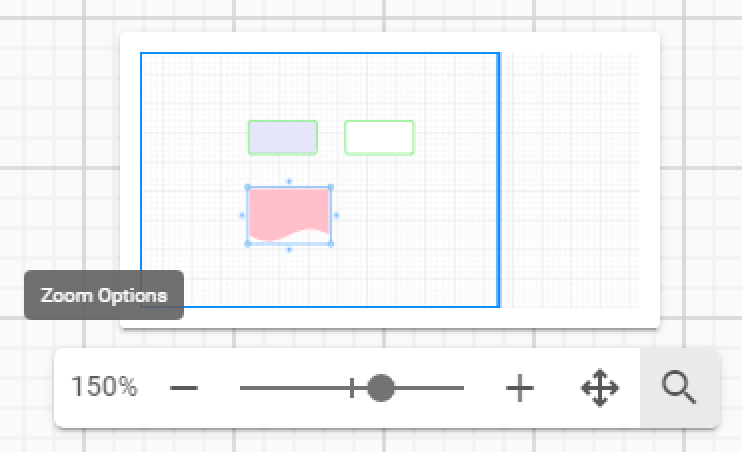
Zoom Controls |
Zoom In, Reset Scaling, Zoom Out and Full Screen. |
|
|
Canvas Controls |
Undo, Redo, Save & Publish, Help and Exit Edit Mode. |
|
|
Editor Menus |
Home to the different BP Modeler Panes: Diagram, Appearance, and Actions. |
|
|
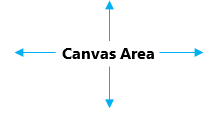
Canvas Area |
The area where the edited/created Process Diagram will display. |
|
Navigation
BP modeler controls that can be used when editing a diagram.
Click Summary
|
Mode |
Click Type |
Behavior |
|
Standard |
Single |
Displays the Context pane for that Shape/Connector in the Menu pane (edit properties, connect another Shape, add/remove Swimlane). |
|
Double |
Opens the Properties sub-menu and enables the Name and Title fields for entering or editing the Shape/Connector's name. |
Keyboard Shortcut Summary
|
Keyboard Shortcut |
Behavior |
|
Ctrl+ + |
Zoom In |
|
Ctrl+ - |
Zoom Out |
|
Esc |
Deselect all shapes |
|
Ctrl+Z |
Undo the last change |
|
Ctrl+Y |
Redo the last change |
|
Enter |
Save Diagram/Shape/Connector changes when editing properties |
|
Delete |
Deletes selected Shape(s)/Connector(s) |
|
|
BP modeler is a licensed application. In order to use it, additional licenses are required on a per user basis. |
Drafting & Publishing
When BP modeler is enabled for an Object Type, 2 menus are created; a drafts menu and a published menu.
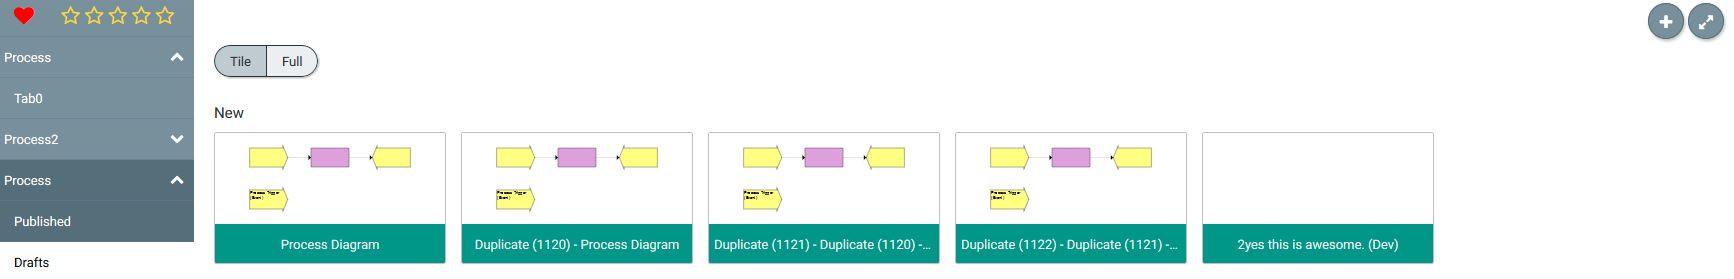
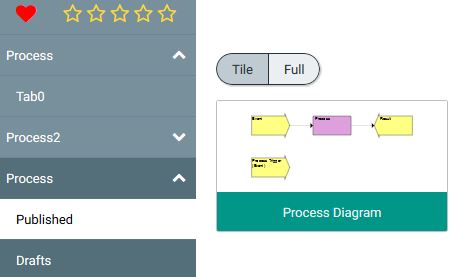
Drafts Menu
The Drafts menu displays all the current drafts for the specified object type. Drafts can be viewed in Tile view, or Full view. Hovering over the draft will reveal the draft controls:
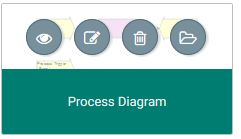
These controls allow you to view, edit, delete or open the diagram in the Object page.
Published Menu
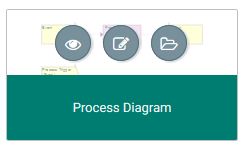
The Published menu displays all the published diagrams for the specified object type. Drafts can be viewed in Tile view, or Full view. Hovering over the draft will reveal the diagram controls:
These controls allow you to view, edit or open the diagram in the Object page.
Creating New Diagrams
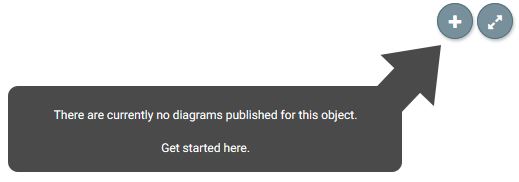
In the top-right of the Drafts and Published pages there is an icon that can be clicked to create a new diagram:
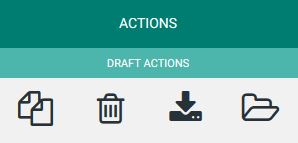
Duplicating Diagrams
To duplicate diagrams, edit an existing diagram and navigate to the Actions menu:
Clicking the first icon will result in a duplicate of the current draft being created.
What do you want to do next?
Enable BP modeler
|
|
BP Modeler is not enabled by default. |
To Enable BP modeler:
The Server Configuration Dialog will open.
BP modeler will be enabled for use on your Site.
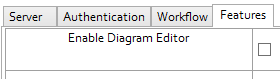
1.Open Evolve Designer and select the Evolve Designer Models launcher dialog, click on the Server Configuration button:
2.Open the Features tab and check the Enable BP modeler check box.
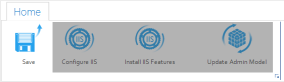
3.With the function enabled, Open the Dynamic Deployment tab and click the Save button to commit the changes to your Site.
Adding BP modeler Pages to Object Types
|
|
If you already have eModeler enabled (from version 3.1 or lower) for an Object Type you will need to remove or delete the eModeler nodes prior to completing these steps. |
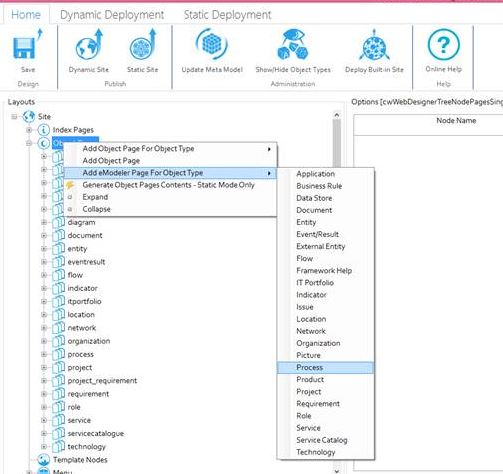
In Evolve Designer, right click on Object Pages and hover over Add BP modeler Page for Object Type to expand the list of Object Types. Simply click an object type and Evolve will automatically add the pages to view BP modeler drafts and published diagrams.
Once your configuration is complete, publish your Evolve site as usual.
Configuring a dynamic template to support BP modeler
|
|
You should already have a Process diagram template configured in CW Modeler that offers the shapes you would like to use in your Process diagram palette. |
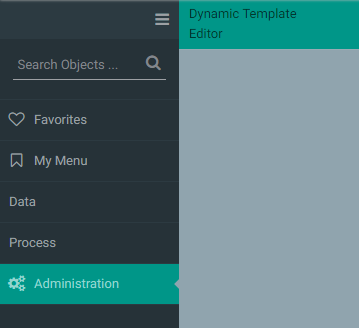
Launch Evolve and login as a System Manager and you will now have an Administration menu, under which you will see Dynamic Template Editor.
Create a New Diagram from an Existing Template
To Create a New Diagram from An Existing Template:
A sub-menu for that process will open, listing three options to select from:
The Process Flow page will open.
The BP modeler canvas will open and you can begin to create your new Process Diagram.
1. Open Evolve and click on the Processes tab.
2. Click on the All Processes option to display a list of all available processes.
3. From the list displayed, select the Process that you wish to build a Diagram for.
oProcess
oProcess Flow
oProperties
4. Click on the Process Flow option.
5. Click on the Create a new diagram based on the template [Template Name] link at the top of the screen.
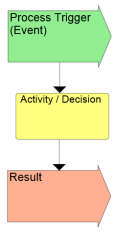
Create a Basic Linear Process Diagram
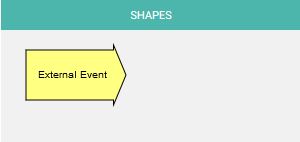
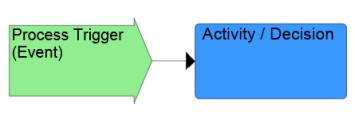
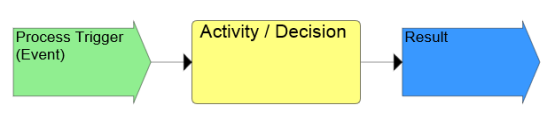
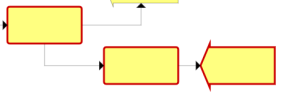
A basic Process Diagram will capture three simple steps: The Event that triggers the process, an Activity or Decision, and a Result.
To Start Your Basic Process Diagram:
See Create a New Diagram from an Existing Template.
The Shape will be transferred to the Canvas Area.
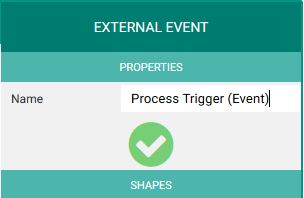
The description will be added to the Shape:
|
|
|
|
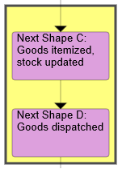
The Next Shapes available for selection will then display in the Shape Menu Pane:
The second Shape will be transferred to the Canvas Area and connect to the existing Event Shape:
The Next Shapes available for selection will then display in the Shape Menu Pane:
This final Shape will be transferred to the Canvas Area and connect to the existing Activity/Decision Shape:
Your basic Process Diagram is now ready to be saved.
See Saving your Work in eModeler.
1. Open eModeler and select the appropriate Process from which to create the new Diagram.
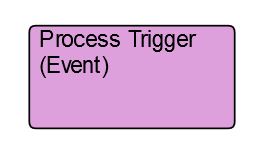
2. In the Shape Menu Pane, click on the appropriate Event Shape.
3. Add a description or title to the Shape by entering details into the Name field in the Properties Menu Pane.
4. Click on the green circle containing a tick, the Validate your Changes button, displayed beneath. Alternatively, press the Enter button on your keyboard.
5. Select the next Activity/Decision Shape by clicking on it.
6. Add a description or title to the Shape and save it.
7. Select the available Result Shape by clicking on it.
8. Add a description or title to the Shape and save it.
9. Save your Diagram.
Saving your Work in eModeler
To Save a Draft
Drafts save automatically as they are edited, so you will never have to worry about accidentally closing the browser and losing all of your changes.
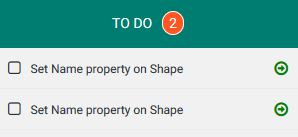
To Do Menu Pane
There is a fourth, hidden, menu pane called To Do, which only appears if there are any aspects of your Diagram requiring action. The To Do menu will list these actions and the Shapes relating to these tasks will be highlighted by a red border. Users will be prevented from saving your work until these actions are addressed.
|
|
|
Once the actions have been completed, you will be able to successfully save your work.
1. Select a Task from the list to be taken to the relevant aspect of the Diagram requiring action.
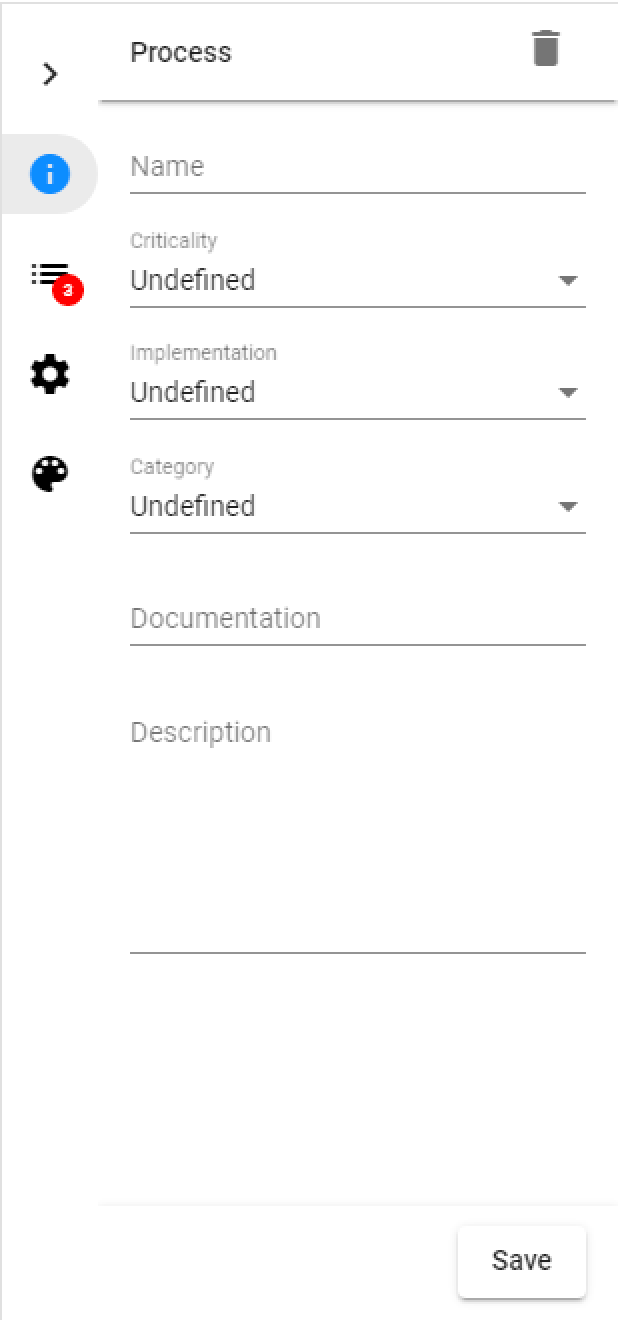
Add Descriptions and Properties to a Shape
To Add a Description or Property to a Shape:
As soon as new information is added to the fields, a green circle containing a tick, the Validate your Changes button, displays beneath.
|
|
|
|
|
|
eModeler supports all diagram elements typically available to CW Modeler diagrams, except for the following Property Types: oDate Range oDistribution Properties oThe use of Memotext in HTML5 For a full list of the existing Regions supported, see: Shape Regions. |
1. Click on the Diagram tab to select the required Shape and add it to the Diagram.
2. In the Properties section of the Diagram tab, enter the desired information into the Name and Title fields.
3. Click on the Validate your Changes button to save your new description to the Shape.
Create a Connection between Shapes: Add Alternative Branches (Simple)
There are three ways to create a connection between two shapes. Each method is described below.
To Create a Connection Between Two Shapes, Either:
The Shape will be highlighted by a solid border to indicate that it has been selected.
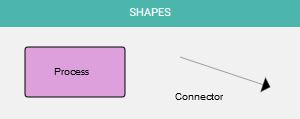
A Connector linking the Shape to your mouse pointer will appear.
The linked Connector follows the mouse pointer. The Connector will turn red when encountering Shapes that cannot be connected to, and green with those Shapes that it can.
The Connector will link the two Shapes, indicating that a connection between the two has been made.
1. Select the first shape by clicking on it.
2. Click on a Connector from the Shapes Menu pane.
3. Move your mouse pointer to the Shape you would like to connect to (target Shape).
4. Click on the Canvas to end Shape selection.
OR
The Shape will be highlighted by a dashed border to indicate that it has been selected.
A Connector will link the two Shapes, indicating that a connection between the two has been made.
1. Click and hold (long-click) on the first Shape to select it.
2. Double-click on the target Shape.
OR
A Connector will link the two Shapes, indicating that a connection between the two has been made.
1. Hold down the Shift key and click on the first Shape to select it.
2. Double-click on the target Shape.
|
|
For Shapes that are not rectangular in nature, Connectors will connect to the Shape's boundary, and not directly to the Shape itself. |
Create a Connection between Shapes: Add Alternative Branches (Multiple)
There are three ways to create connections between multiple Shapes. Each method is described below.
To Create a Connection Between Multiple Shapes:
The Shape will be highlighted by a solid line to indicate that it has been selected.
Each additional Shape will be highlighted with a dashed border to indicate Multiple Selection Mode.
Connectors will link the Shapes, indicating that connections have been made between them.
1. Select the first shape by clicking on it.
2. Hold down the Shift key and click on the next shape.
3. Double-click on the final target Shape to end the multiple selection.
OR:
The border of the Shape will be highlighted with a dashed border to indicate that it was been selected.
Each additional Shape will be highlighted with a dashed border to indicate Multiple Selection Mode.
Connectors will link the Shapes, indicating that connections have been made between them.
1. Select the first shape by clicking and holding on it (long-click).
2. Click on the extra Shapes required.
3. Double-click on the final target Shape to end the multiple selection.
OR:
Each Shape will be highlighted with a dashed border to indicate Multiple Selection Mode.
Connectors will link the Shapes, indicating that connections have been made between them.
1. Press and hold down the Shift key.
2. Click and drag your pointer over the area containing the Shapes to be selected.
3. Once you are happy with the Shapes selected, release the Shift key stop dragging across the area.
4. Double-click on the final target Shape to end the multiple selection.
|
|
For Shapes that are not rectangular in nature, Connectors will connect to the Shape's boundary, and not directly to the Shape itself. |
Delete Shapes from the Diagram
To Delete a Single Shape or Connector from your Diagram:
The Clear Shape icon will display:
The Shape or Connector is deleted.
1. Select the Shape or Connector.
2. Click on the Clear Shape icon
To Delete Multiple Shapes or Connectors from your Diagram:
The Clear Shape icon will display.
The Shape or Connector is deleted.
1. Select the necessary Shapes or Connectors.
2. Click on the Clear Shape icon.
To Delete a Swimlane from your Diagram:
The Swimlane will be deleted but the Shape[s] attached to it will remain.
1. Select the Swimlane and proceed to delete as with a Shape or Connector.
Assign Swimlane Elements to your Process
It is possible to group or assign various aspects of your diagram to a particular Swimlane element. Assigning Shapes to a Swimlane can provide clarification about which organizational roles or functions are responsible for which parts the process being captured in your diagram.
To Assign a Shape[s] to a Swimlane:
1. Click on the required Shape[s] that you would like to assign.
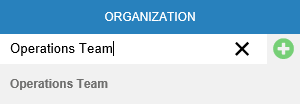
2. In the Selection Menu Pane, a Swimlane Sub-menu pane will appear. The sub-menu will use the same title as the element placed inside the Swimlane category in the Diagram Template Editor. In the example below, the Swimlane element is 'Organization'.
3. You will be prompted to either search for or create a the new group to assign the Shapes to:
The previously selected Shapes will be assigned to the new group.
1. Select (or create) the desired group.
To Change the Name of a Group/Swimlane Element:
A solid border will appear around the element Shape (Organization grouping).
The Swimlane (Organization) sub-menu will appear in the Editor Menus area.
The new description will be added to your Shape.
1. Select the Swimlane element by clicking on it.
2. Enter the new element name into the properties field provided.
3. Click on the green Validate your Changes button to save your new description to the Shape. Alternatively, press the Enter key on your keyboard.
|
|
|
|
To Remove a Swimlane from your Diagram:
A solid border will appear around the element Shape (Organization grouping).
The Swimlane (Organization) sub-menu will appear in the Editor Menus area.
The Swimlane element is removed from your Diagram.
1. Select the Swimlane element by clicking on it.
2. Click on the Clear Shape icon located in the in the Properties section of the pane:
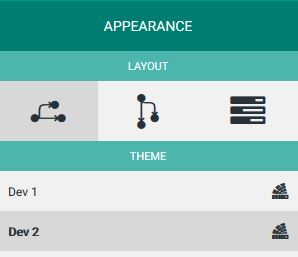
Change the Appearance of your Diagram
When creating your Diagram, it is possible to adjust the both the orientation of the Diagram and the Theme used.
To Open the Appearance Options:
The Appearance Menu options will display:
1. Open your Diagram Draft and click on the Appearance Menu Pane.
2. Select the appropriate option.
To Change the Orientation of your Diagram:
|
|
|
Alternatively;
|
|
|
The Diagram will change orientation accordingly.
1. Open the Appearance Menu Pane.
2. Click on the Left to Right icon to display your Process Diagram from left to right across the screen:
3. Click on the Top to Bottom icon to display your Process Diagram from the top to the bottom of the screen:
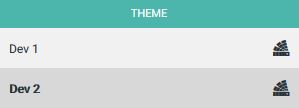
To Change the Theme Used by your Diagram:
A list of Themes available for selection will display in the Theme sub-menu.
The new Theme will be applied to your Diagram.
1. Open the Appearance Menu Pane.
2. Select your chosen Theme by clicking on the relevant pane:
Exit eModeler
To Exit the Application:
The screen returns to the previous Process Summary page.
1. Click on the Close Edit Mode icon at the top of the screen:
Using Web Modeler
Overview of Web Modeler - Editing Diagrams Online
|
|
Please check with your Administrator that firstly, your Server and Internet Browser meet the necessary system requirements to use Web modeler. Secondly, check with your Administrator that the Web Modeler feature is enabled. |
Web modeler is used to both edit and create any Evolve Diagram online.
The different features within the Editor are detailed below:
|
Diagram Title |
Editable title for the diagram, this differs from the diagram name, which must be unique |
Click to rename the title |
|
Zoom Controls |
Zoom % - Click to choose presets Radar button All can be collapsed to a single magnifier button. |
|
|
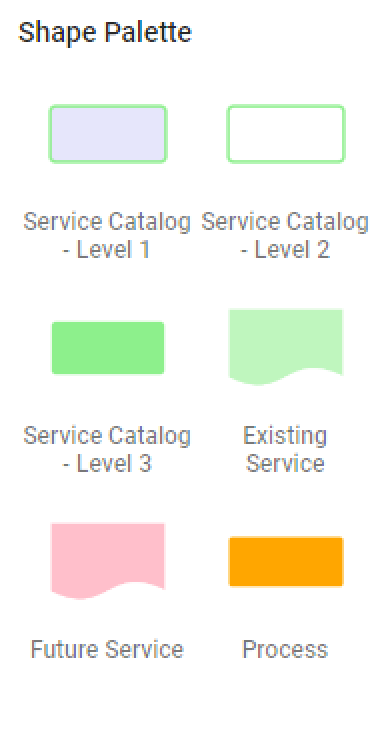
Shape Palette |
The Shape Palette contains all the shapes that can be used on the diagram.
Note that lines / connectors are drawn from the (+) buttons around the sides of a selected shape. |
|
|
Shape and Diagram Tools |
Home to the different Web Modeler Panes: Properties, To Do, Settings and Styles. |
|
|
Canvas Area |
The area where the edited/created Process Diagram will display. |
|
Navigation
Web modeler controls that can be used when editing a diagram.
Click Summary
|
Mode |
Click Type |
Behavior |
|
Standard |
Single |
Selects a shape and updates the "Shapes and Diagram Tools" pane for that Shape/Connector, if the pane is open. |
|
Double |
Opens the "Shapes and Diagram Tools" pane, if it is closed, and navigates to the Name and Properties tab. For easy access to the object details. |
Keyboard Shortcut Summary
|
Keyboard Shortcut |
Behavior |
|
Ctrl+ + |
Zoom In |
|
Ctrl+ - |
Zoom Out |
|
Esc |
Deselect all shapes |
|
Delete |
Deletes or Clears the selected Shape(s)/Connector(s) |
|
|
Web modeler is a licensed application. In order to use it, additional licenses are required on a per user basis. |
Enable Web Modeler
This page explains how to enable web modeler step by step
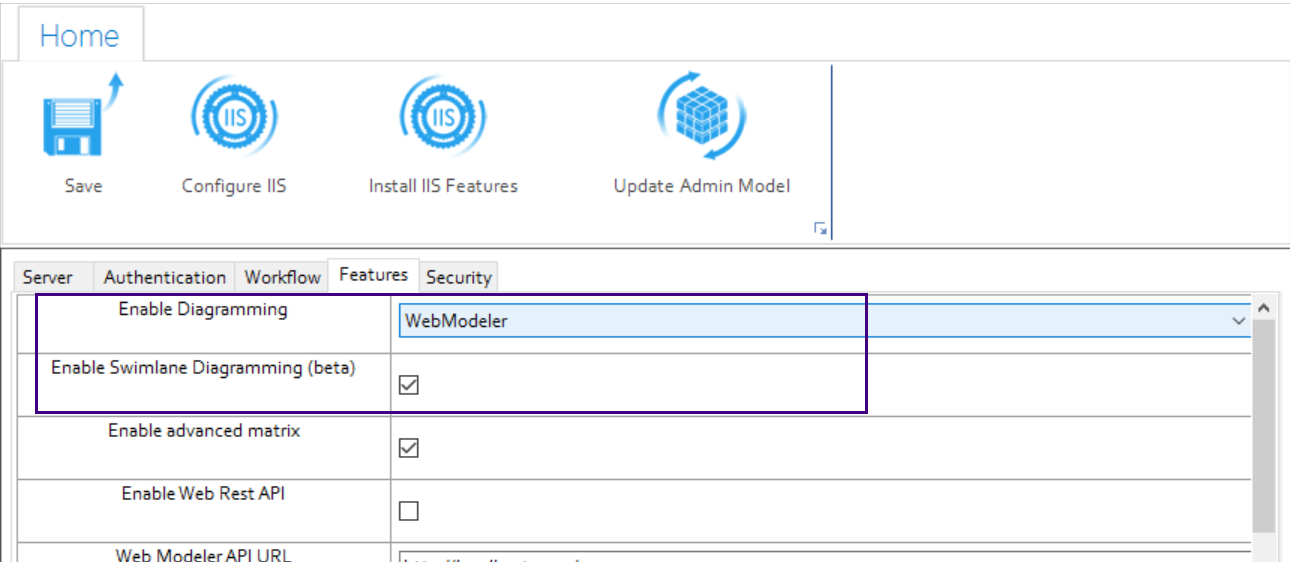
Steps to Configure Evolve Web Platform:
1. Logon to Evolve Designer.
2, Go to the Features tab
o Enable Diagramming – Choose Web Modeler from the drop-down list.
o Check the Enable Swimlane Diagramming.
3. Click on Save.
4. Then click on the Configure IIS button to configure Evolve Web Platform.
Steps to Setup Global Search:
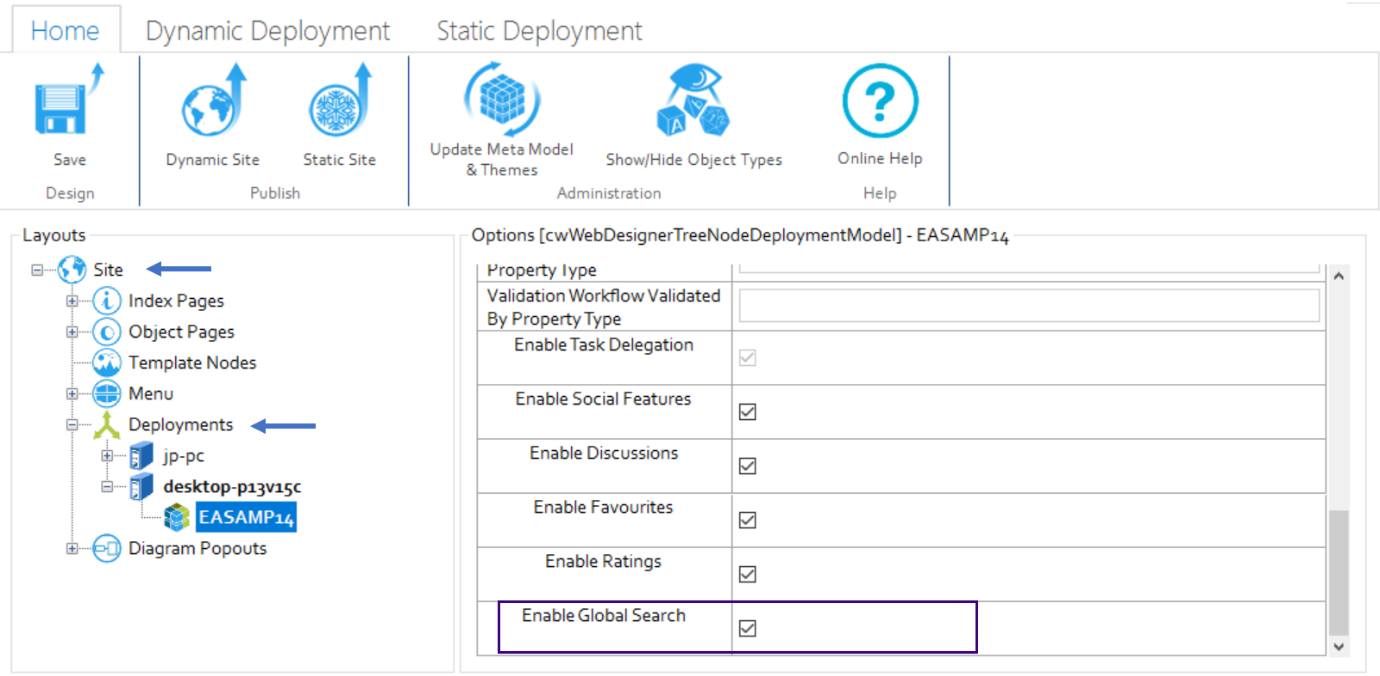
In Evolve Designer:
1. Select the model you wish to work with, e.g. Sample Model and then click on Site.
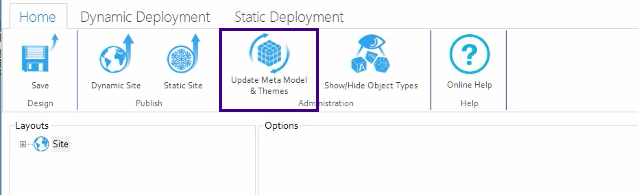
2. If your meta-model is out of date you may need to update it. If so, click on Update Meta Model & Themes.
3. Click on Show/Hide Object Types to show the hidden object types. You will need this in the later steps when you enable a user as a Diagrammer.
4. Under the Layouts tab, expand the nodes of Site, Deployments. Select the deployment node of your device.
5. Scroll down to the bottom and check the Enable Global Search. Global search is required to enable the Web Modeler to find pre-existing objects in your model. This is needed where you wish to add them to your diagrams.
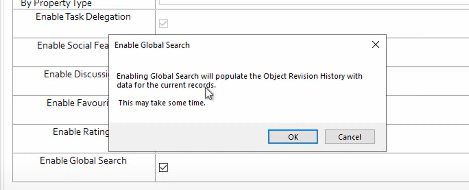
6. A popup appears which says populate the Object Revision History with data for current records. Click OK.
7. Then click on Dynamic Site to republish the site.
Steps to Configure the CW User as a Diagrammer:
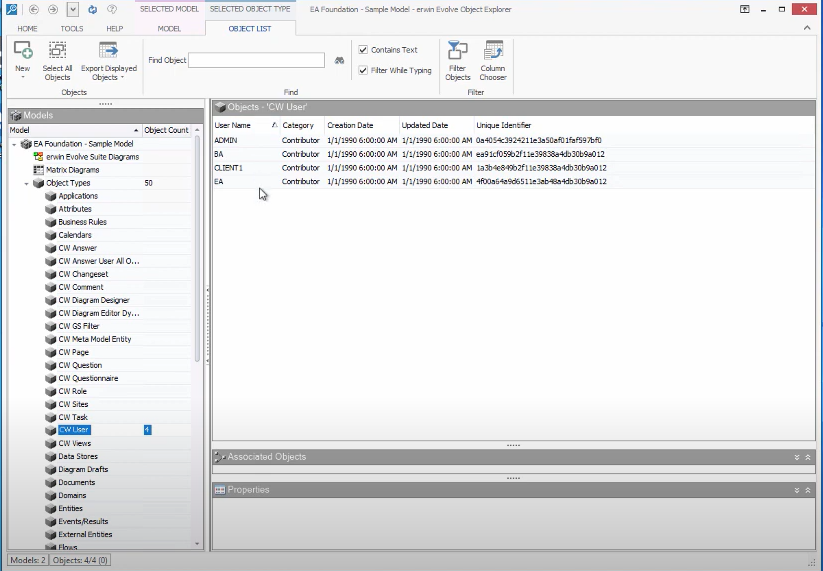
1. Go to erwin Evolve Suite, then click on Object Explorer.
2. Expand your Model, e.g. EA Foundation – Sample Model.
3. Scroll down and click on CW User.
By default, all the user Categories will be shown as a Contributor.
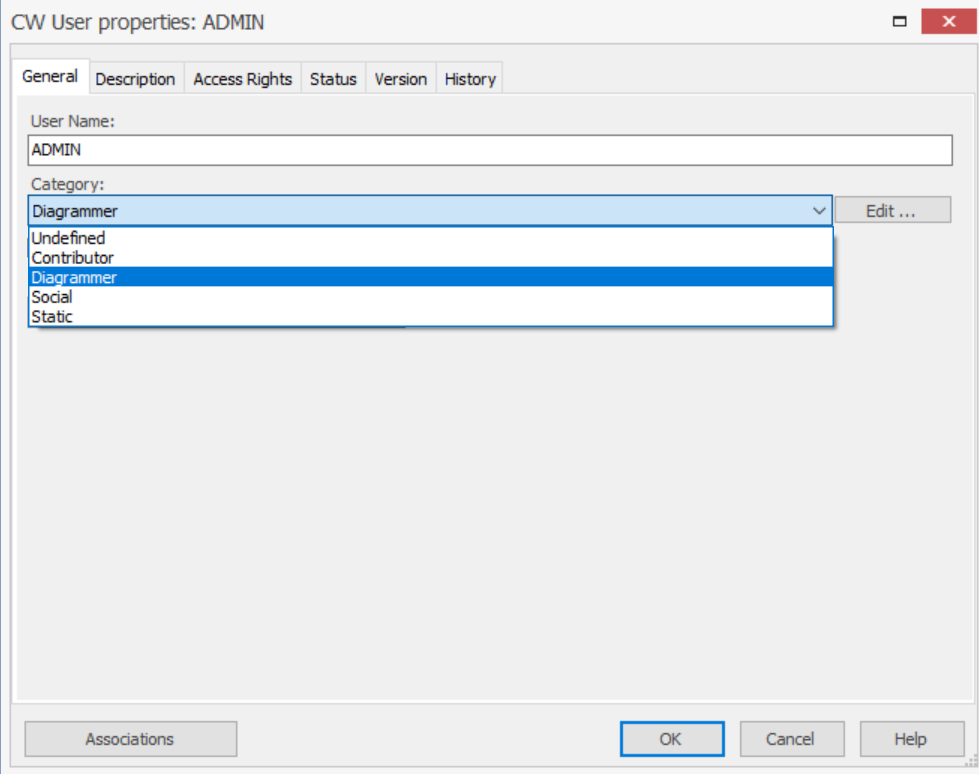
4. Double click on the user you wish to change to be a Diagrammer. e.g. ADMIN.
The CW User Properties window appears and under the tab General choose Diagrammer from the drop-down list of Category and then click OK.
Now, when that user logs in, as they are now a Diagrammer, they will see the web modeler.