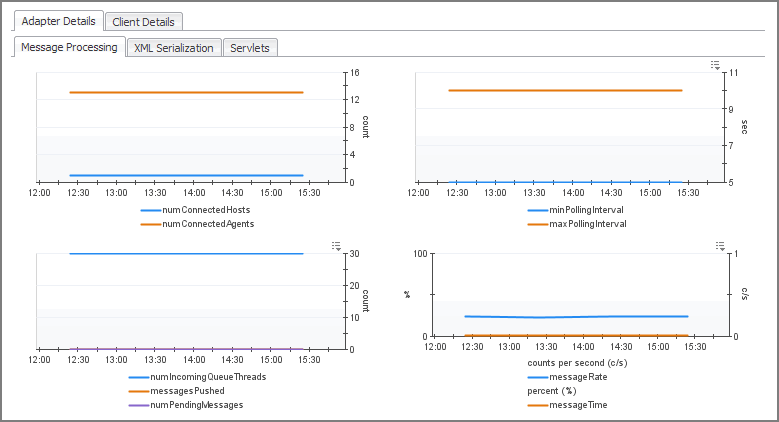
The Message Processing tab contains graphs that tell you how well the adapter is handling incoming messages. It displays the numbers of connected hosts and agents, the number of incoming queue threads, and the numbers of pushed and pending messages over time. It also shows the minimum and maximum polling intervals, the rate of incoming messages, and the percentage of time the adapter spends on message processing.
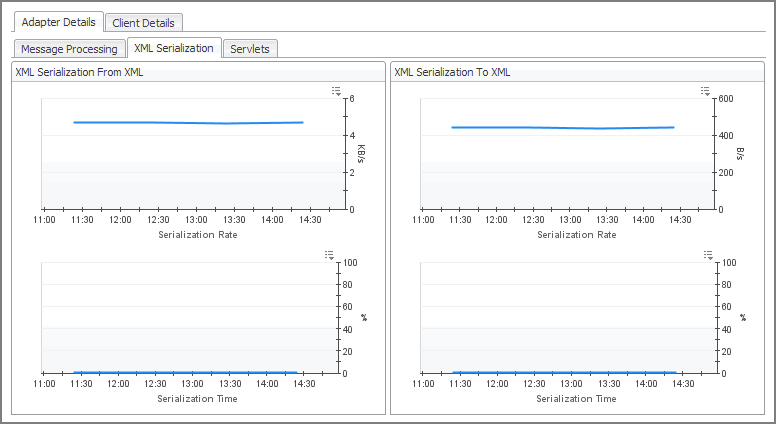
The XML Serialization tab shows graphs indicating the rates and times of message serialization to and from XML used by the adapter over the selected time range. High peaks in the graphs can indicate signs of performance decrease and may need to be investigated.
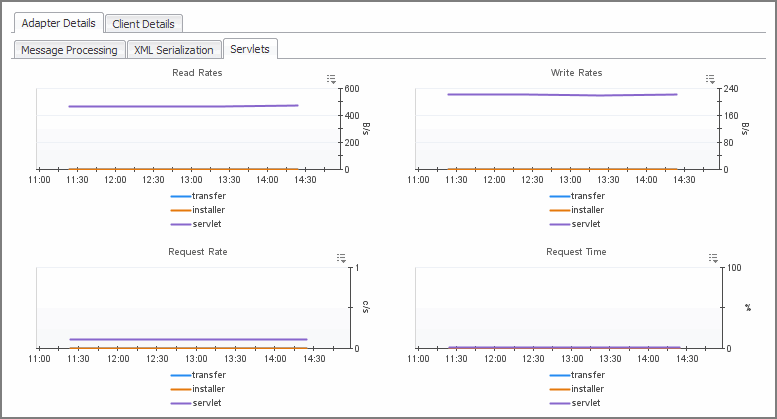
The Servlets tab displays graphs that indicate the rates of read, write and request rates for the individual Adapter servlets: transfer, installer, and servlet, over the selected time range. It also shows the percentage of time the adapter spends on the requests coming from these components.
The Client Details tab allows you to investigate the performance of the Agent manager clients adapters that are connected to the FglAM Adapter. Use it to see their overall performance rates and to investigate any potential bottlenecks.
For more information about the data appearing on this tab, see the following topics: