Chat now with support
Chat with Support

Foglight for Exchange 5.7.2 - User and Reference Guide

Navigation basics Exploring the Foglight for Exchange dashboards Managing Exchange agents Reporting on your Exchange environment Foglight for Exchange views
Role views Exchange Server views Site views Cluster views Description of Embedded views
Agent State view Alarms view Auto Attendant Calls view Auto Attendant Directory Access view Auto Attendant General view Auto Attendant Transfers view Cached LDAP Searches/sec view CAS AB Load view CAS AB Service view CAS ActiveSync view CAS Control Panel Load view CAS Load view CAS OAB Download view CAS RPC Client Access view CAS RPC Client Access Load view CAS RPC HTTP view Client Access Features view Cluster Database Details view Cluster Storage Group Details view Cluster Summary and Resource Information view Cluster Summary view Clusters Listing view CPU view Disk view Domain Controllers view Edge Agent view Edge Transport Features view Exchange Roles Server Summary view Exchange Server Roles view (reference information) Exchange Servers in This Cluster view Exchange Servers view (Exchange Cluster Environment Summary) Exchange Servers view Host Monitor view Hub Transport Features view IP Address view Mailbox Features view Mailbox Store Assistant view Managed Availability Recovery Action Results view Memory view Network view Processes LDAP Read Time view Resource Utilization view Roles Listing view Roles Explorer view Role Features State view Roles Top 3 view Server Health view Server Listing view Servers in Site view Servers In This Site view Site By Category view Site Listing view Store Calendar Attendant view Store Client Search view Store Content Indexing view Store Database view Store Public Load view Store Resource Booking view Store RPC Client Throttling view Store Transport view Store User Load view Summary and Resource Information view Top 3 CPU Consumers view Top 3 Memory Consumers view Top 3 Network Consumers view Top 3 Storage Consumers view Total LDAP Read Time On All DCs view Total Long-Running LDAP Operations On All DCs view Transport Dumpster view Transport Edge Sync view Transport Extensibility Agent view Transport Load Store Drivers view Transport Queues view UM Availability view UM Call Answer General view UM Call Answer view UM Fax view UM General Current view UM General view UM Subscriber Access Calendar view UM Subscriber Access Directory view UM Subscriber Access General view UM Subscriber Access Message view Unified Messaging Features view Windows Services view
Foglight for Exchange rules Running diagnostic tests Managing Exchange metrics

Configuring the agent to log on as a service

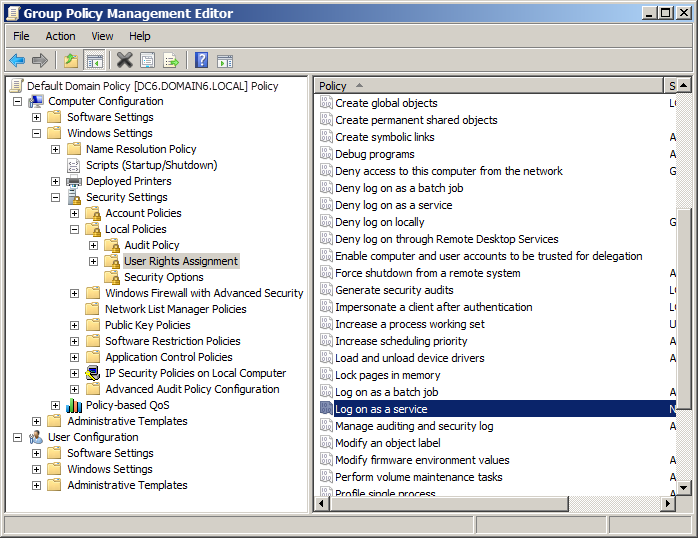
Monitoring agent accounts must be assigned the Log on as a service policy, otherwise the data collection is disabled and results in the following error:

This error may be generated if the monitoring agent uses an account that does not have permissions granted to use this policy, or if the ..\Windows\RemoteCommandService.exe file or the Quest Remote Command Service are corrupted or missing.

Permissions to access this policy can be granted using the Group Policy Management Editor in the monitored environment.

1
Start the Group Policy Management Editor. In the Control Panel, click Administrative Tools > Group Policy Management.
2
In the Group Policy Management Editor window that appears, in the left pane, click Default Domain Policy > Computer Configuration > Windows Settings > Security Settings > Local Policies > User Rights Assignment.
3
In the right pane, locate the Log on as a service policy.
4
Double-click the Log on as a service policy.
The Log on as a service Properties dialog box appears.
5
Click Add User or Group.
The Select Users, Computers, Service Accounts, or Groups dialog box appears.
7
In the Log on as a service Properties dialog box, click OK.
8
On the monitored server, delete the ..\Windows\RemoteCommandService.exe file.

Managing Exchange metrics

Exchange agents collect metrics by default which are then displayed throughout the Foglight for Exchange views. In addition, Exchange agents can be configured to collect other metrics in addition to those being collected by default.

Foglight for Exchange provides an additional dashboard that can be used to view and manage metrics that can be optionally collected by an Exchange agent. Optional Exchange metrics can only be enabled or disabled using this new dashboard. However, data collection schedules can be modified using any of the following dashboards:

Agent Status dashboard (Dashboards > Administration > Agents > Agent Status)
Agent Properties dashboard (Dashboards > Administration > Agents > Agent Properties)
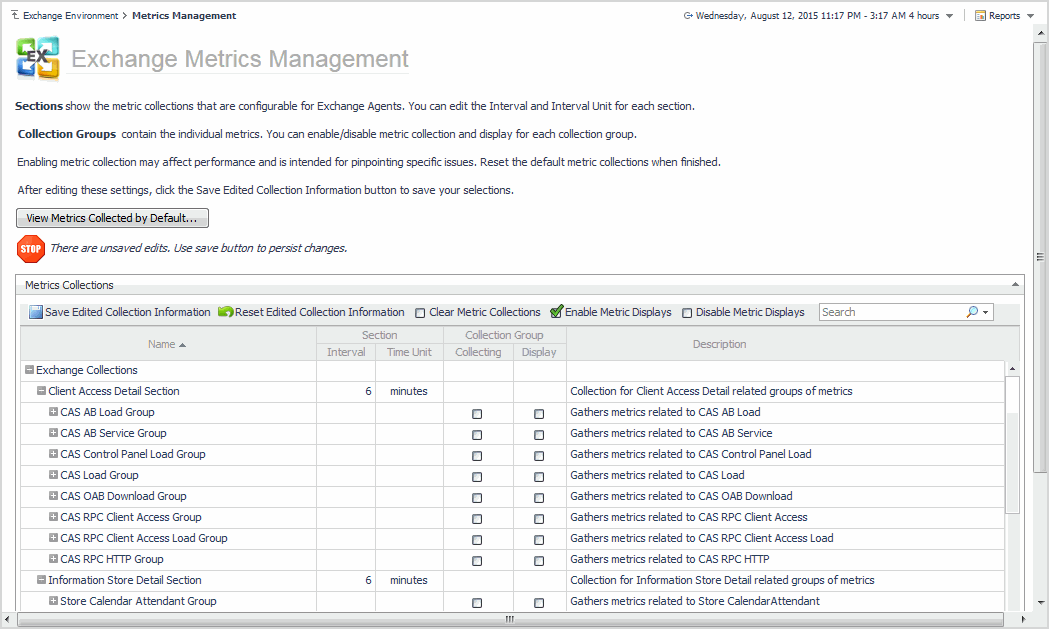
Exchange Metrics Management Dashboard (Dashboards > Exchange Environment > Administration tab > Metrics Management)

This section describes the components on the Exchange Metrics Management dashboard. It also provides procedures for enabling and disabling metric collections and for modifying the data collection interval to be used to collect metrics.

For details, see these topics:

Agent Status and Agent Properties dashboards

The Agent Status and Agent Properties dashboards allow you to edit an agent’s properties. Use the Data Collection Scheduler setting on these dashboards to modify the data collection schedule to be used to collect performance metrics.

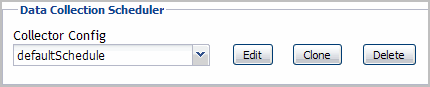
Use the controls in this panel as described in the following table.

Collector Config

Specifies the data collection schedule to be used to collect performance metrics.

Edit

Select this button to edit the data collection schedule selected in the Collector Config field.

Clone

Select this button to create a copy of the data collection schedule selected in the Collector Config field. This schedule can then be used as a basis for creating a new data collection schedule.

Delete

Select this button to delete the data collection schedule selected in the Collector Config field.

Exchange Metrics Management dashboard

The Exchange Metrics Management dashboard lists the metrics that can be optionally collected by an Exchange agent. Using this dashboard, you can enable these metrics to pinpoint specific performance issues or to modify the interval to be used to collect data.

The metrics displayed on the Exchange Metrics Management dashboard are divided into the following components

The Exchange Metrics Management dashboard contains the following information for each collection metric:

Name

Lists the Exchange Collections and when expanded, the sections, collection groups and individual metrics included in each collection group.

To expand the Exchange Collections to display the sections, collection groups and individual metrics, click the expansion box to the far left of the collection, section or collection group name.

Section

Displays the interval and time unit to be used to collect data. By default, the interval and time unit displayed are the default settings defined in the defaultSchedule.

Collection Group

Indicates whether the metrics in the collection group are to be collected and/or displayed.

Description

Displays a brief description of each section, collection group, and individual metric.

Use the buttons on this dashboard as described in the following table.

Displays the Exchange Default Metrics dialog which contains a list of all the metrics being collected and displayed by default.

Saves changes made to any setting on the Metrics Management page.

Rolls back unsaved changes made to any settings on the Metrics Management page to their original values.

Resets the collection group settings (Collecting and Display) for the metrics in all manually enabled collection groups.

Enables the display of the metrics in all manually enabled collection groups.

Disables the display of the metrics in all manually enabled collection groups.

Use the search control to filter the information displayed on the Metrics Management dashboard.

Related Documents

The document was helpful.

Select Rating

I easily found the information I needed.

Select Rating