Chat now with support
Chat with Support

NetVault 11.4.5 - Administration Guide

Introduction Getting started Configuring clients Configuring storage devices Backing up data Managing policies Restoring data Managing jobs Monitoring logs Managing storage devices
Monitoring device activity Managing disk-based storage devices in table view Managing disk-based storage devices in tree view Managing tape libraries in table view Managing tape libraries in tree view Managing tape drives in table view Managing tape drives in tree view Adding shared devices
Managing storage media Managing user accounts Monitoring events and configuring notifications Reporting in NetVault Backup Working with client clusters Configuring default settings for NetVault Backup
About configuring default settings Configuring encryption settings Configuring plug-in options Configuring default settings for post-scripts Configuring default settings for Verify Plug-in Configuring Deployment Manager Settings Configuring Job Manager settings Configuring Logging Daemon settings Configuring Media Manager settings Configuring Network Manager settings Configuring Process Manager settings Configuring RAS device settings Configuring Schedule Manager settings Configuring Web Service settings Configuring Auditor Daemon settings Configuring firewall settings Configuring general settings Configuring security settings Synchronizing NetVault Time Configuring default settings for global notification methods Configuring the reporting utility Configuring NetVault Backup to use a specific VSS provider Configuring default settings using Txtconfig
Diagnostic tracing Managing diagnostic data Using the deviceconfig utility NetVault Backup processes Environment variables Network ports used by NetVault Backup Troubleshooting

Managing jobs

Viewing job activity

You can monitor the progress and status of your jobs from the Job Status page. You can also use this page to manage your jobs and perform various job-related tasks.

2
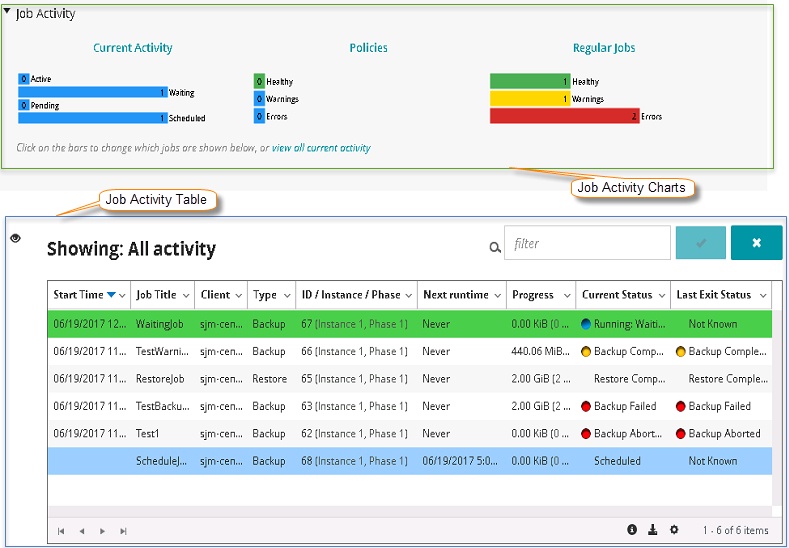
On the Job Status page, you can view the following information.
Figure 18. Job Status page

Table 49. Job Status page

Job activity charts

This area shows the summary for current jobs, policy jobs, and regular jobs in the form of bar charts:

Current Activity: The individual bars represent the number of jobs that are in active, waiting, pending, and scheduled states.
Policies: The individual bars represent the number of policy jobs that have completed successfully, completed with warnings, and failed. The Healthy count of policies shows the number of policy jobs that have completed successfully when all the jobs in the policy are successful. It shows 0 count if one or more jobs in the policy have warnings or errors.
Regular Jobs: The individual bars represent the number of regular jobs that have completed successfully, completed with warnings, and failed.

You can click a job activity to display the job details for that category in the job activity table. For example, you can click Policies in the Job Activity area to display the policy jobs in the job activity table.

You can click a bar in the activity chart area to display the job details for that category in the activity table. For example, you can click the Active bar in the Current Activity area to display the jobs that are in progress.

To return to the default view type for the activity table, click the View all current activity link.

Job activity table

By default, the table lists all current job activities (All activity category).

For the All Activity category, you can view the following information: start date and time, job title, client name, job type, job ID number (also shows the instance and phase), next run time (date and time when the next instance is scheduled to run), progress (current or average transfer rate), current status, and last exit status.

The following job status light icons are displayed in the current status and last exit status columns based on the exit status:

Red light: Aborted, Died, Failed, Did not run
Yellow light: Warnings, Stopped
Blue light: Waiting for media

The following row background colors are displayed for a job based on current status:

Green: Running
Blue: Scheduled

You can change the view type and also filter the records displayed in the table:

Change the view type: To view the job details for a different job category, click the corresponding bar in the activity chart area. For example, to view the jobs that have completed with warnings, click the Warnings bar in the Regular Jobs area.


Filter the records: To filter the records displayed in the activity table, click the View icon, and set the following filter options:

Plug-in type: To view jobs for a particular plug-in, click all jobs, and then select the plug-in.
Age filter: The configuration setting Number of days to keep job status determines which records are shown on the Job Status page.


To set the view of Actions option as a context menu in the Job Activity table, follow these steps:

1
In the Header pane of NetVault Backup WebUI, click the Options icon. Options dialog box is displayed.
2
In the Page Options section, select A content menu within the table to view the context menu as a column within the table.
3

Viewing job calendar

You can view your jobs for a month, a week, or a day on a calendar. It can be helpful to view your jobs in the calendar format to ensure that there are no scheduling conflicts. You may want to verify the calendar before you create a job. You can monitor the progress and status of your jobs from the Job Calendar page. You can also use this page to manage your jobs and perform various job-related tasks.

2
On the Job Calendar page, you can view the following information.

Settings

Filter By Status: This area shows the following filter options based on the job status:

Scheduled: To display the scheduled jobs, click this button.
Active: To display the in-progress jobs, click this button.
Success: To display the jobs that have completed successfully, click this button.
Warnings: To display the jobs that have completed with warnings, click this button.
Errors: To display the jobs that have failed, click this button.

By default, all the jobs are displayed on the Job Calendar page. You can select one or more filters to display the corresponding jobs on job calendar.

Timeslot Size: For Weekly and Daily view, you can set the time granularity for the jobs on calendar using Timeslot Size field.

To set the time granularity, select any of the following time slot sizes: 1 min, 5 mins, 15 mins, 20 mins, 30 mins, or 60 mins.

By default, the time slot size is set to 30 mins.

You can select the preferred filters and persist the setting over browser sessions.

Job Calendar

This area displays the jobs on the calendar based on Filter By Status and Timeslot Size settings.

You can view your jobs for a month, a week, or a day on calendar. By default, weekly view of the Job Calendar is displayed. To display monthly view, click ‘month’ or to display the daily view, click ‘day’.

Monthly view: Displays the jobs for the month. The height of the job is fixed in this view.

Weekly view: Displays the jobs for a week. The height of the job is corresponding to the time taken to run the job.

Daily view: Displays the jobs for a day. The height of the job is corresponding to the time taken to run the job.

The Red color line on the Job Calendar shows the current time.

Move the pointer over a job to see the job summary such as job title, start time, end time, and so on.

Managing jobs

This section includes the following topics:

Related Documents

The document was helpful.

Select Rating

I easily found the information I needed.

Select Rating