 |
|
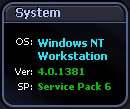
Displays information about the operating system of the machine you are currently connected to. OS — Operating system — The version name of the Windows operating system that is installed on the target machine. Ver — Version — The full version number of the Windows operating system installed on the machine. SP — Service pack — The name of the service pack installed on the machine (if any). |
|
|
|
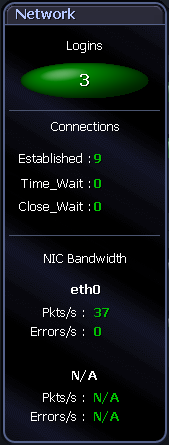
The Network panel shows the total number of connected users, and the rate at which packets are being sent from and received by the system: Windows Networking Users — Shows the number of clients connected to this system.
Open Sessions — The current number of Windows Networking sessions open on this machine.
Theoretical Bandwidth Limit — Shows the level of network traffic graphed against a "theoretical" maximum bandwidth for the network card specified. If there are multiple network cards, use Windows Network Card Display to select the one whose data you want to display.
Selected Network Card — The name of the network interface card (NIC) selected for diagnosis. If there are multiple network cards, use Windows Network Card Display to select the one whose data you want to display.
NBT KB Received — Represents the rate at which NetBios TCP/IP data is being received by the system from Windows Networking clients. NBT KB Sent — Represents the rate at which NetBios TCP/IP data is being sent from the system to Windows Networking clients.
Total KB Received — Represents the rate at which network data is received by the system from other network systems. Total KB Sent — Represents the rate at which network data is being sent from the system to other network systems. |
 |
|
The Event Logs panel provides a link to the Event Log drilldown.
Note: This button is enabled on Enable Event Logs selected. Windows Event Log Metrics |
|
|
|
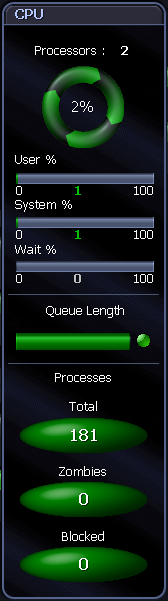
The CPU panel shows processor and load information for the Windows system: CPUs — The number of processors installed on the target system. Speed — The speed of the processor(s) installed on the target system. Type — The type of processor(s) installed on the target system (Intel Pentium III, for example). Up Time — Shows how long it has been since Windows was started on the machine being diagnosed. Total CPU Usage — This spinner represents the total amount of CPU being used on the machine being diagnosed. It includes CPU consumed by all windows processes. This component spins faster as CPU demands increase. Processor Queue Length — Shows the average number of threads (program execution units) that are waiting to run on each processor. A sustained average greater than three can indicate processor congestion. Processes — Shows the number of applications and services that are currently active on the system. Threads — Shows the number of threads currently active in all processes. A thread is a running portion of the owning process. Every process has at least one thread.
Page Outs per second — Shows the number of memory pages per second that are being written to disk from physical memory, in order to free up physical memory. The memory pages are checked first to see if they have been modified - if no modification has taken place, they are discarded. Page Faults per second — This is a measure of the number of page faults per second on the system. This value includes soft faults and hard faults. A page fault occurs when a process requires code or data that is not in its space in physical memory. A soft fault is when a memory page is not in the physical memory of the process, but resides in another segment of physical memory. A hard fault occurs when a memory page is not in the physical memory of the process, and has to be brought from disk.
Cache Writes — This flow shows the rate at which cache pages are written to disk from memory, in order to satisfy a write through request (an application request to not write information to cache, but directly to disk) or a cache flush (a regular writing of data from the write-cache to disk). Cache Reads — Shows the rate at which cache pages are read by applications from memory.
|