An important feature within Spotlight is the ability to display, collect and replay the behavior of a Spotlight connection at a specified point in time such as when an important alarm was raised.
The details shown via the History browser are identical in format to those displayed by Spotlight in its "live" state, so you can view historical data in the same way as you would view a live connection.
To view Spotlight history
Select an event in the snapshot list.
The Spotlight browser displays a tree of alarms and snapshots in chronological order, together with some basic navigation controls.
|
Action |
Description |
|---|---|
|
Click Last week, Today etc. |
Spotlight maintains a list of snapshots that have been raised for each day in the specified historical period. Click a day to have Spotlight display a list of all snapshots that were recorded for that day. |
|
Click a snapshot or alarm |
View the status of the connection at the time of the snapshot or alarm. |
| Right click | Live view | Return the view of this connection to the present time. Live connections |
| Right click | History Interval | Define the interval between snapshots displayed in the History browser. From the drop-down list, choose the frequency with which you want to display a snapshot. |
History browser toolbar
|
Control |
Description |
|---|---|
 |
Previous alarm. Show the snapshot corresponding to the alarm before the one currently displayed. |
 |
Previous snapshot. Show the snapshot immediately before the one currently displayed. |
 |
Play (plus Playback speed). Activate playback mode. This automatically steps through the snapshots in sequence. Note: Click the down arrow to select a playback speed. Select Custom to define a playback speed. |
 |
Next snapshot. Show the snapshot immediately after the one currently displayed. |
 |
Next alarm. Show the snapshot corresponding to the next alarm after the one currently displayed. |
 |
Select date/time. Click to nominate the date and time to display. Spotlight will find the snapshot closest to this time to display. |
Notes:
The Spotlight Home Page is the main page for the monitored system. It highlights obvious bottlenecks and problem areas. Statistics and flows are updated in real time.
To see the Spotlight Home Page
Click Home.

About the Spotlight home page
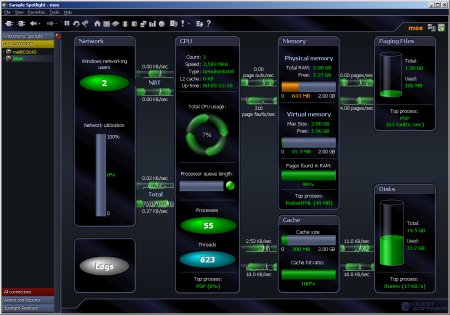
The connection identifier in the upper right corner of the Spotlight console identifies the system being monitored. Alongside the connection identifier there may be additional icons. The following activity icon indicates whether Spotlight is collecting data from the connected system.

Calibrate Spotlight Connections
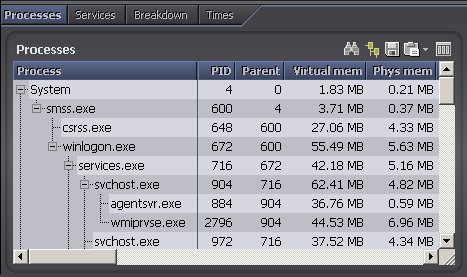
A drilldown contains one or more pages that display a detailed breakdown of the monitored system's performance.
To open a drilldown
About Spotlight drilldowns
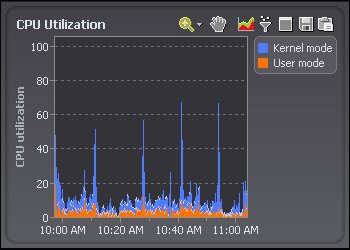
Drilldowns mainly use two different types of displays – tables and charts.
Drilldowns have the following features:
Return to the previous page or drilldown in the browse sequence
Click the down arrow to select the page to return to.
Note: Back is disabled at the start of the browse sequence.
| Toolbar | Menu | Shortcut |
|---|---|---|
Click  |
Click View | Back. |
Press ALT+LEFT |
View the next page or drilldown in the browse sequence
Click the down arrow to select the page to go to.
Note: Forward is disabled at the end of the browse sequence.
| Toolbar | Menu | Shortcut |
|---|---|---|
Click  |
Click View | Forward. |
Press Alt+Right |
Return to the Spotlight home page
| Toolbar | Menu | Shortcut |
|---|---|---|
| Click |
Click View | Close Drilldown. |
N/A |
