The Disks tab can be found on the following dashboards:
|
• |
The Disks tab displays the physical disks associated with the selected entity.
|
• |
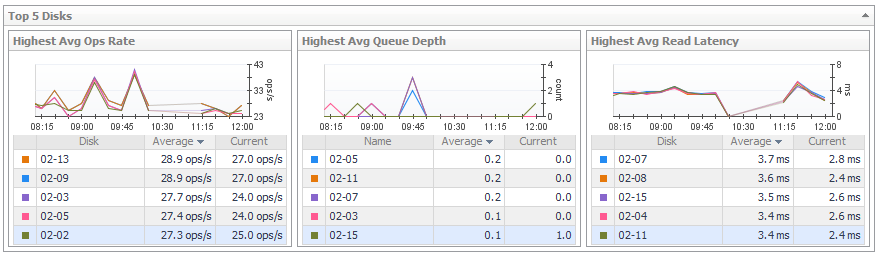
Top 5 Disks. Displays the top five disks with the highest average value for Ops Rate and the performance metrics most useful for this array or filer. |
|
• |
Disk Status Filter. Click to show only disks with the selected status in the Disk Details table. |
|
• |
Disk Details. For each disk, identifies its status, physical state, parent pool or aggregate, and Disk Size, and then displays current values for Ops Rate, % Busy, Average Queue Depth, Data Rate, and Latency. Click a |
|
• |
Alarm Summary. Displays alarms on disks. |
This section describes the following topics:
|
1 |
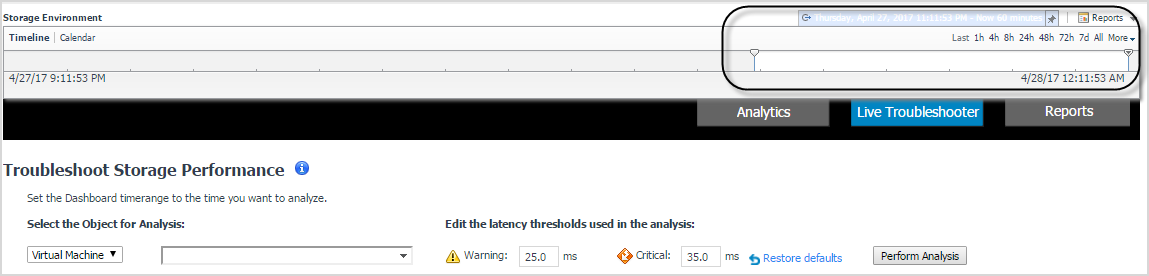
On the navigation panel, under Dashboards, click the Insights tab, and then click Live Troubleshooter. |
|
4 |
|
5 |
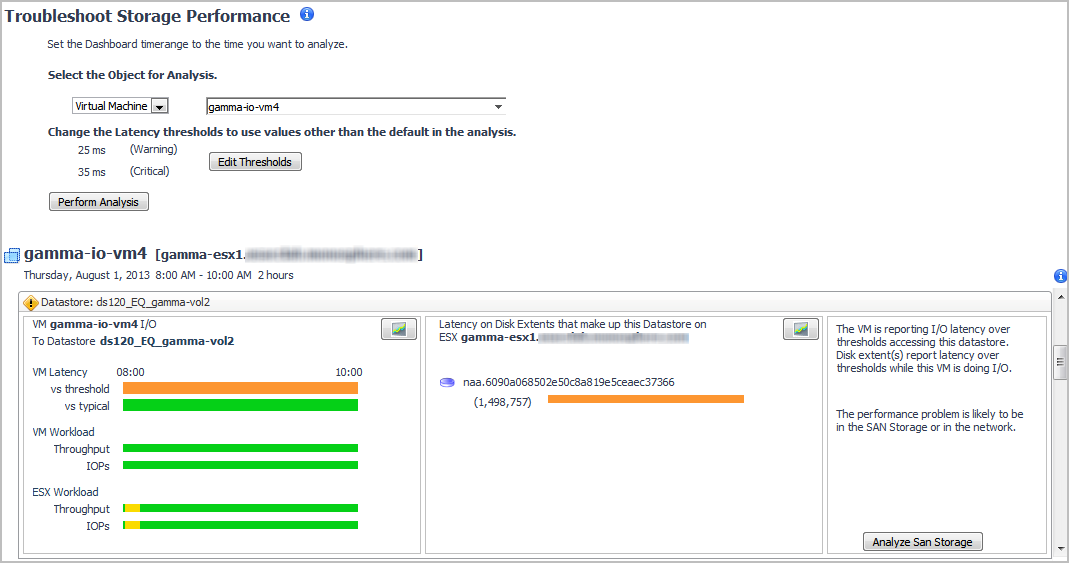
Click Perform Analysis. |
|
• |
If a Normal |
|
• |
If the Attention |
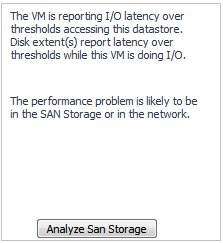
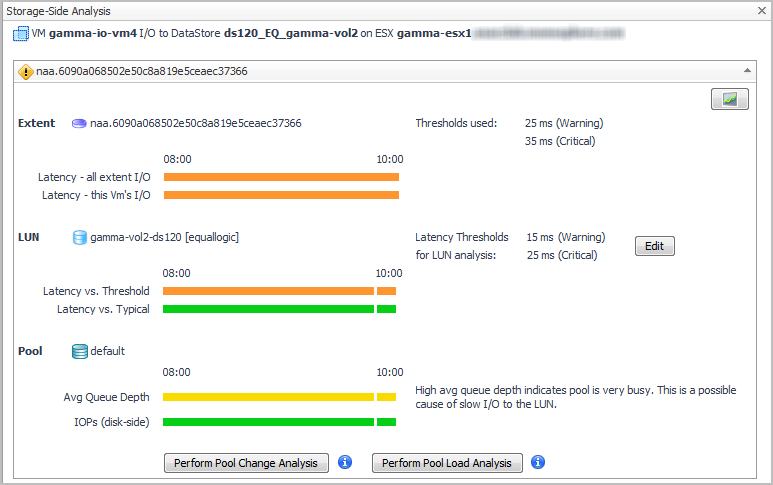
If the view for a datastore or RDM disk extent shows the Attention icon, the troubleshooting algorithm has discovered evidence of a performance problem related to storage. The problem may or may not be in the SAN Storage environment. Review the details to determine the cause of the performance issue.
Each datastore/RDM view has three summary panels (from left to right):
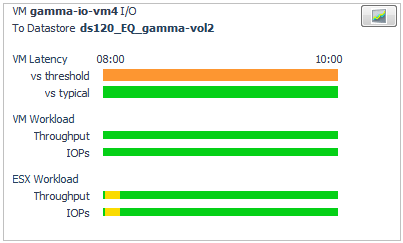
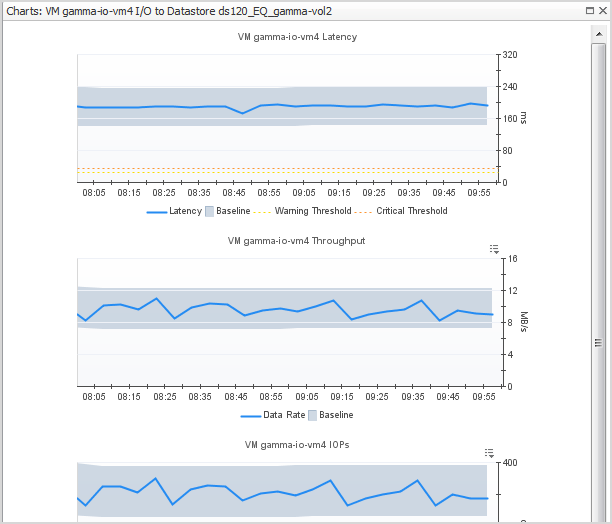
A virtual machine may be connected to multiple datastores and RDM disk extents, each of which may report varying degrees of problems. When a virtual machine has more than one datastore/RDM view, start by scanning the timeline bars in the VM I/O to Datastore/RDM panel to identify a datastore/RDM with consistently slow I/O performance or significant changes from typical performance.
|
1 |
In a view showing the Attention |
|
2 |
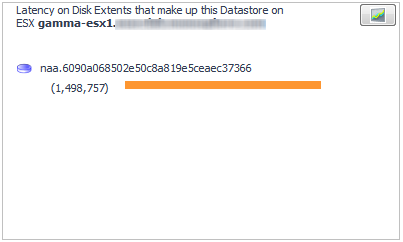
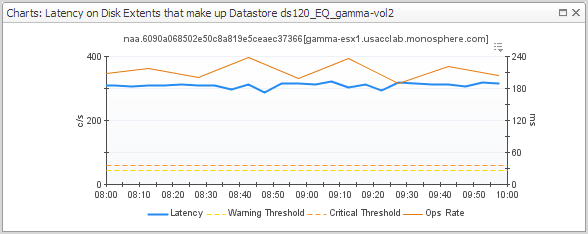
Now look at the Latency for Disk Extents summary (middle panel) to identify the disk extents that are contributing to the problem. |
|
a |
|
c |
|
5 |
In the Diagnosis panel, click Analyze SAN Storage. |
|
• |
