A chart is a component on a Spotlight page that shows data as a graphical image.
| Feature | Description |
|---|---|
|
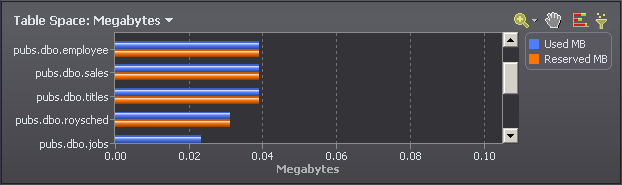
Label |
A brief text description of the information represented in the chart. Note: If the label displays a down arrow, the chart supports more than one category of data. Click the label or arrow to open a drop-down list of all available categories. Click an item in this list to display information related to that category. |
|
Use the buttons on the toolbar to configure the way that the chart presents information.
Note: Individual toolbar buttons may not be available in all chart views. | |
|
The legend lists all the data series associated with the chart. Click an item in the legend to highlight its series in the chart. (Click a second time to return the series to its normal appearance.) Move the mouse pointer over an item in the legend to view the current value for that series within the chart.
Note: Arrows at the top and bottom of a legend (if displayed) indicate that there are more items in the legend list. Click an arrow to scroll through the list. | |
|
Chart body |
The charted information is displayed in the body of the chart. Right-click over the chart body to
Notes:
|
Note: If Spotlight is unable to collect the data required, Spotlight displays a small icon 


