Sustained high I/O wait time rates are a good indicator that of a disk subsystem bottleneck and that I/O device service times will be degraded. When Spotlight detects unusually high disk activity on the SQL Server machine it raises an alarm.
Spotlight looks at SQL Server I/O wait times to determine if there is an IO bottleneck. A value larger than 15 ms/IO indicates a possible bottleneck.
The thresholds for the I/O wait time alarm are:
| I/O Wait Time |
Alarm severity |
|---|---|
| 0 - 15 | Normal |
| 15 - 50 | Medium |
| 50 - infinity | High |
After detecting a potential disk bottleneck, Spotlight displays an alarm on the home page and in Spotlight Today.

The first thing we need to do is identify the process that is generating high amounts of I/O activity.
| From the Spotlight Home Page | From Spotlight Today |
|---|---|
|
Click Diagnostics | IO.
|
Select the alarm and click Diagnose.
|
This opens the I/O Diagnostics drilldown. The I/O Diagnostics drilldown helps you answer questions such as:
The first grid on the I/O page shows the possible causes of high I/O and the likelihood of each contributing to this instance of the alarm. Click an item in the grid to display an explanation of the diagnosis and supporting information.

Blocking in SQL Server occurs when a session that was performing some task is unable to progress because it must wait on a resource that is currently being used by another session. The resource that is being waited on can be either a physical structure like a lock on a table or an internal SQL Server resource such as a latch.
Excessive blocking can be a major cause of poor application performance since it reduces the throughput of the system. Often a user of an application does not realize that they are waiting on a resource held by another user. From their point of view, it often seems like their application has stopped responding.
When diagnosing blocking, you want to start your investigation by answering the following questions:
Spotlight not only alerts you to blocking issues in your database but also helps you answer the above questions so you can quickly resolve the problem causing the blocking.
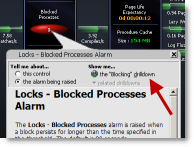
When Spotlight detects a blocking issue, an alarm is displayed on the home page.

The first thing we want to do is look at the Blocking drilldown. The Blocking drilldown shows details about the current blocks and in particular, answers the questions stated above.
On the Spotlight homepage, click the Blocked Processes button, and then click the “Blocking” drilldown.
The Blocking grid shows the sessions that are either blocked or are causing other sessions to be blocked. The hierarchy in the tree diagram makes it easy to see which session is causing the blocking. In addition, the resource on which the sessions are waiting is displayed. You can ask Spotlight to resolve these to actual object names by clicking on the ‘?’ button. The time spent waiting and the SQL last executed are also displayed.
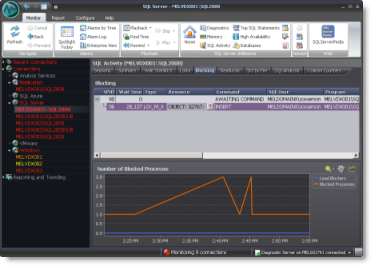
From here, you can view session details.
Click View Session Details.

In Spotlight, you can view events and data collected in the recent past as though they were happening in real-time. You can do this via the Playback ribbon The Spotlight home page and page drilldowns show details in playback identical in format to that displayed in "live" state, so you can view historical data in the same way as you view a live connection.
To playback time
Click to show:
| Alarms | Description |
|---|---|
|
Select an alarm or moment in time in the past to return to and view in the Spotlight home page and page drilldowns. | |
|
|
Return to present time the Spotlight home page and page drilldowns. |
|
|
Go back in time on the Spotlight home page or page drilldown. Click the associate arrow to define how far back to travel: 1 minute, 5 minutes, 10 minutes, 1 hour or 1 day. |
 Skip Skip |
Starting from the past, skip forward in time on the Spotlight home page or page drilldown. Click the associate arrow to define how far forward to skip: 1 minute, 5 minutes, 10 minutes, 1 hour or 1 day. |
 Play Play |
Starting from the past, step forward in time through the alarms in sequence. Show on the Spotlight home page or page drilldown. Click the associate arrow to define the speed of play. |
Click Playback and a new control opens.

| Control | Description |
|---|---|
 |
Select the date. Use the back and forward buttons to change the date. |
 |
Click the time to playback to. The alarms list scrolls to show those alarms occurring at the selected time. Note: The time scale is colored according to the most severe alarm for the connection. |
 |
The alarms occurring on the selected date. Click an alarm to playback to the time the alarm occurred. Note: The color indicates the severity of the alarm. |
Identifying expensive SQL can be a time consuming process. Use the SQL Analysis feature in Spotlight to identify SQL that is consuming resources on your server.
With SQL Analysis, you can quickly answer questions such as:
Answering these questions will help you to direct your tuning efforts more productively.
SQL Analysis uses either ROWSET or sampling Server Side trace to collect raw data on SQL statement execution. It then aggregates this data by similar SQL statements so that potentially thousands or even millions of rows of raw data are distilled down into an aggregate picture of workload.
You can set filters at point of collection so that only the events that you are interested in are collected and when viewing the data, you can also filter the data to narrow the focus down even further.


 Real Time
 Rewind