To launch the SCM Services Setup application:
1Navigate to the location where the SCM Services files reside (by default, C:\Program Files\Metalogix\ControlPoint Online\ControlPointFeatures\Services\ContentAnalysis)
2Open CASetup.exe (using the Run as Administrator option).
You can change the following SCM Services Configuration and Settings from the SCM Services Setup application.
IMPORTANT: After making any changes, remember to click [OK] to save them.
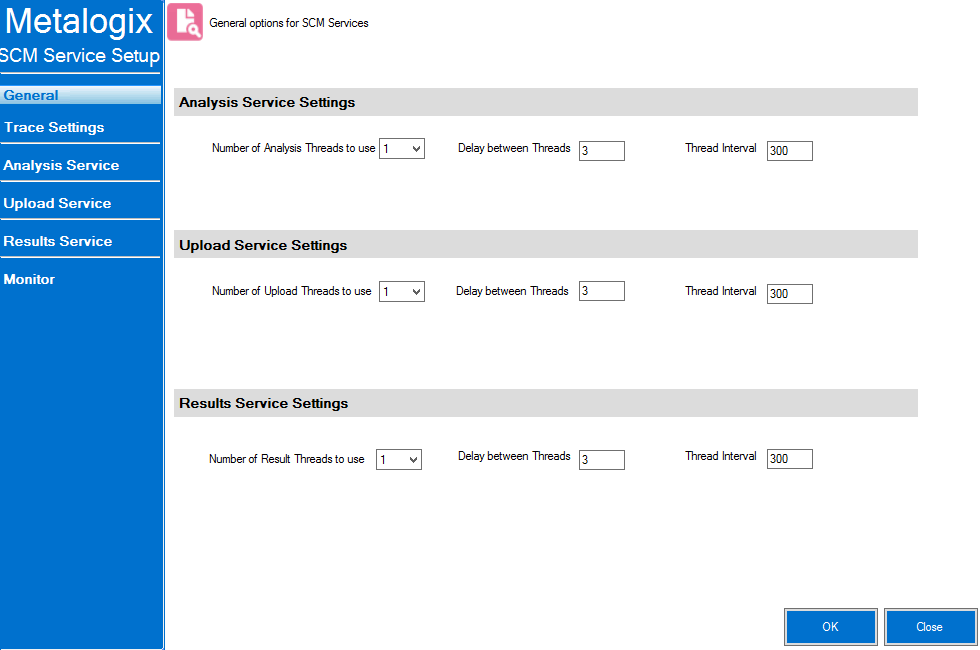
General Options
For Analysis Service Settings, Upload Service Settings, and Results Service Settings, you can adjust the number of threads used, the time delay between threads (in seconds) and the intervals (in seconds) at which each thread "wakes up" to check for files to be uploaded to and results to be downloaded from Sensitive Content Manager.
NOTE: The default values for these settings should be acceptable for most Sensitive Content Manager analysis jobs. However, you may want to adjust them if, for example, you are processing an exceptionally large number of large files and have sufficient system resources to handle multiple (up to four) threads. Be aware, however, that if you increase the number of threads and decrease the delay and/or thread interval, you may significantly increase the size of the log file(s).

You can use the Trace Settings drop-downs to change the level of logging for components of each SCM Service.
You can monitor the progress of active file scans via the SCM Services Setup - Monitor tab. You can also choose to Auto Refresh the monitor at a rate of anywhere from 1 to 5 seconds.
When all active jobs have been processed, Files Processing Statistics are reset to 0.
You can view the details of ControlPoint SCM Upload Service and Results Service activity in the applicable log file, located in the folder where SCM Service files reside (by default, C:\Program Files\Metalogix\ControlPoint Online\ControlPointFeatures\Services\ContentAnalysis).
At a minimum, a new log is created each week, and the file name is in the format {Service Name}{WeekOfTheYear}{MMMyyyy}.log. For example, CPCAUploadService11Mar2022.log. Once a log file exceeds 10KB, however, a new log is created with both a date and time stamp.
The level of detail recorded in the log depends on the SCM Trace Switch values. The size of the log file is also influenced by General Options.