Share Excel Linked Queries
You can use linked queries to create "live" Excel reports that can be refreshed dynamically. Because a linked query contains the underlying SQL for a report, each time you refresh the report the query is executed and the latest data is retrieved. The dynamic nature of linked query reports makes them ideal for distribution to users who need to see changes to data without waiting for scheduled updates or for new reports to be distributed.
Notes:
-
Any user who opens an Excel linked query must have access to a user name and password for the queried database to refresh the data. If a user does not have access to the database, they can only see the original data in the spreadsheet.
-
If the Excel linked query was created from an ODBC connection that uses a Data Source Name (DSN), the DSN must also exist on the computer where the Excel file is opened to refresh the data.
|
Scenario You need to create an Excel linked query so that the Regional Sales Manager, can track whether the Sales Representatives in his region meet their monthly and quarterly goals. By providing a linked query, you only have to create the query once, and then the Regional Sales Manager can refresh the data at any time to view the latest sales information. |
To create an Excel linked query
- Connect to the database.
- Create a query in the Query Builder or Editor.
- Execute the query to display data results.
-
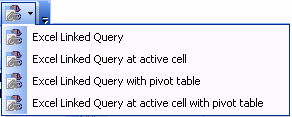
Select the result set and click one of the following options from the toolbar:
- Save the Excel spreadsheet.
- Email or upload the spreadsheet to a shared network folder to share it with colleagues.
To refresh data in an Excel linked query
- Open the spreadsheet with the linked query in Excel. The original data from the query displays.
- In Excel, select Data | Refresh to update the original data with the current data.
-
If prompted, enter a user name and password to connect to the database and refresh the data.
or
If the following error displays: "[Microsoft][ODBC Driver Manager] Data source name not found and no default driver specified", you must specify the DSN used by the query on your computer. Complete the following steps to resolve this issue:
- Click OK.
- Select the Machine Data Source tab, and then click New.
- Use the wizard to select a User Data Source and create a DSN that points to the database.
- Click OK to return to Excel and open an ODBC Driver Connect window.
- Enter a user name and password to refresh the data.
Report
Tutorial: Create a Toad Data Report
Use the Data Report Designer to design reports visually. Stored in .tdr files, data reports are "live" reports that can be refreshed dynamically. What makes them dynamic is that they contain the underlying queries for report data sets. Each time a data report is opened, its query runs and the latest data is retrieved. The dynamic nature of data reports makes them ideal for distribution to users who need to see changes to data without waiting for scheduled updates or for new reports to be distributed.
The process of creating a data report has the following steps:
- Step 1: Run the Toad Data Report Wizard
- Step 2: Update Fields
- Step 3: Use Styles to Format the Report Appearance
- Step 4: Update Bands and Add Controls
Note: This procedure does not cover all of the possible steps of creating a data report. It only covers the steps required to create a report for the scenario.
|
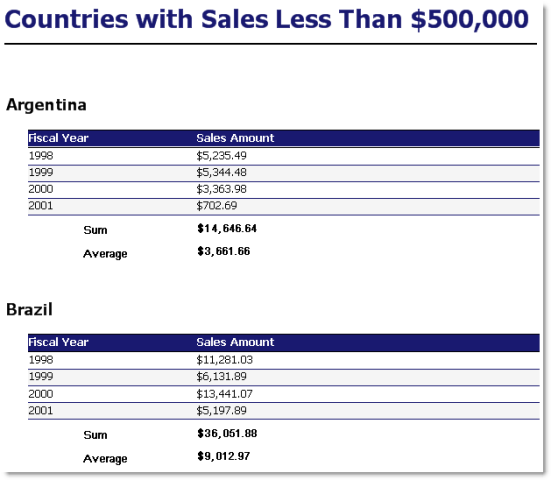
Scenario Your company wants to improve its global sales, starting with countries where it has a customer base but averages low sales. You created a query that displays countries with less than $500,000 in sales per fiscal year, but now you need to create a report to help represent and evaluate the results. The data should be grouped per country and show the total and average sales for each country. In addition, you want the report to look similar to the rest of the company's documents, which use specific colors and fonts. Note: This scenario uses the data generated in Visually Build a Query. |
Step 1: Run the Toad Data Report Wizard
The Toad Data Report wizard creates an initial layout of the report based on options you select, including what columns to include, whether to group data, and the basic style.
To run the wizard
- Right-click the data grid in the Results tab and select Send To | Data Report Designer. The Toad Report Designer displays.
- Select Standard Report and click Next.
- Click
to include all columns in the report and click Next.
-
Select COUNTRY_NAME and click
, and then click Next. This groups the data by the country name so that each country is listed as a heading and its sales per year display below it.
Tip: You can create a secondary group by selecting another column and clicking
- Select the Sum and Avg checkboxes for the SUM(SALES.AMOUNT) row, and then click Next. These options calculate the sum and average sales amount for each country.
-
Select Outline 1 and click Next.
Tip: The Outline and Align Left options are good choices if you grouped the data.
- Select Casual and click Next.
- Enter Countries with Sales Less Than $500,000 in the Report Title field, and then click Finish. The initial report layout displays in the Report window with the information grouped under bands.
- Click Preview to see what the report looks like in print. Previewing the report makes it easier to see how the bands and their content display in the printable report.
Step 2: Update Fields
You can move, rename, and update the category of a field.
To update the fields
- Complete the following steps to update the field category:
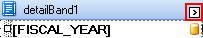
- Select the FISCAL_YEAR field in detailBand1.
-
Click
directly above the field.
- Click
by the Format String field.
- Clear the Prefix field and click OK.
- Double-click the following fields and enter their new name:
Field
Band
Name
FISCAL YEAR groupHeaderBand2 Fiscal Year SUM(SALES.AMOUNT_SOLD) groupHeaderBand2 Sales Amount Avg groupFooterBand1 Average - Select the following fields one at a time and make them wide enough to see the full text: Sum (groupFooterBand1), Average (groupFooterBand1), and Grand Total (reportFooterBand1).
- Select the following fields one at a time and drag them to the one inch mark on the ruler: Sum, Average, and Grand Total.
-
Right-click the COUNTRY NAME field (not the COUNTRY_NAME field on the right) in groupHeaderBand1 and select Delete.
Note: The COUNTRY NAME field is a label that precedes the COUNTRY_NAME field value. If you preview the report before you delete the COUNTRY NAME field, the country displays as 'COUNTRY NAME Argentina'. It is clear that Argentina is the country name, so this field is redundant.
- Select the COUNTRY_NAME field and drag it to align with the report title.
- Select the COUNTRY_NAME field and make it three inches wide to accommodate long country names.
Step 3: Use Styles to Format the Report Appearance
The Data Report Designer uses styles to format different objects and kinds of data. Once you define a style, you can apply it to similar fields to create a consistent and easy-to-update design.
To create, update, and apply styles
- Complete the following steps to update the report title style:
- Select the Styles field in the Properties pane.
- Click
- Select Title.
-
Select the Foreground Color field, and then select MidnightBlue in the Web tab.
Note: All colors in this scenario are from the Web tab.
- Select the Font field and click
- Select 22 in the Size field and click OK.
- Complete the following steps in the Styles Editor window to create and define four new styles:
- Click
four times in the Styles Editor window to create four new styles.
-
Set the following properties for the new styles:
First Style
Properties
Name
OddRow Background Color
WhiteSmoke Border Color
MidnightBlue Borders
Bottom Font
Tahoma, 10pt Second Style
Properties
Name
EvenRow Border Color
MidnightBlue Borders
Bottom Font
Tahoma, 10pt Third Style
Properties
Name
TableHeading Background Color
MidnightBlue Font
Tahoma, 10pt, bold Foreground Color
White Fourth Style
Properties
Name
CountryName Font
Tahoma, 14pt, bold Foreground Color
Black
- Click
- Complete the following steps to apply the new styles:
- Expand the Styles field in the Properties pane.
-
Select TableHeading in the Style field (under Styles) for the Fiscal Year and Sales Amount fields in groupHeaderBand2.
- Set the following fields for [FISCAL_YEAR] and [SUM(SALES.AMOUNT_SOLD)] in detailBand1:
Field
Property
Even Style EvenRow Odd Style OddRow - Select the COUNTRY_NAME field in groupHeaderBand1 and then select CountryName in the Style field.

Step 4: Update Bands and Add Controls
Bands group the information layout in the report and you can add controls to include additional tables, images, fields, and other items in the report.
- Right-click pageHeaderBand1 and select Delete.
- Complete the following steps to add a line under the report title:
-
Select the groupHeaderBand1 and move it down half an inch.
Tip: It is helpful to expand a band before adding controls to give you plenty of room in which to work.
- Drag Line from the Toolbox into reportHeaderBand1.
- Expand it to the width of the page.
- Drag and position it directly below the report title.
- Enter 2 in the Line Width field in the Properties pane.
-
-
Select reportFooterBand1 and drag it down half an inch. This adds white space between the country information.
Click here to see the Data Report Designer layout.
-
Click Preview.
- To save the report, right-click the Data Report Designer tab and select Save File.