The Connection status bar is a floating bar that contains a Spotlight icon for each active (live) connection.
To show / hide the Connection Status bar
Click View | Connection Status Bar
About the Connection Status bar
Right-click the bar to display its shortcut menu. The following options are available:
|
Option |
Description |
|---|---|
|
Transparent |
"Fades" the bar when the mouse pointer is not placed over it. |
|
Text labels
|
Displays the names of the connections in the status bar. |
|
Automatic resize |
Resizes the status bar automatically and activates a scroll arrow. |
|
Sort by |
Sorts the connection icons by Name or Severity. |
Calibrate the Spotlight home page components to display data in the way best suited to the monitored system.
Note: Spotlight automatically calibrates new connections the first time that they are opened. Use this dialog to re-calibrate a connection at any other time.
Scenario: Calibration of data flows
Data flows on the Spotlight home page indicate the rate at which data is being transferred through a system. The faster the rate of traffic, the faster the data flow moves. However, the data flow is an accurate representation of system activity ONLY if Spotlight knows the normal range of values for your system.
If the normal range of values for a data flow is from 0 to 100, a value of 8 is low, and the data flow moves slowly.
If the range of values for your system is from 0 to 10, a value of 8 is high and the data flow moves much faster.
The Spotlight calibration tool calculates the normal range of metric values for your system. Over a set period of time, Spotlight measures the changes in value of important metrics within the system. It uses this data to set the upper and lower display limits for the corresponding components. You can accept the results or adjust them if necessary.
To re-calibrate a connection
Notes:
Spotlight Basics describes how Spotlight applications work. It contains these sections:
| Section |
Description |
|---|---|
| Spotlight Connections |
Create / Modify / Delete connections to systems, and monitor those systems. |
| Monitor Spotlight Connections | Monitor connections, detect alarms, investigate the cause of alarms. |
| Alarms |
Alarms are the warnings that Spotlight raises when a metric falls outside its "normal" range of values. |
| Charts, Grids and Home Page Components | Spotlight displays provide detailed statistics of the monitored system, relevant to diagnosing the cause of alarms. Make the best use of them. |
| View | Options | Customize Spotlight. |
| Troubleshooting | Solve problems using Spotlight. |
Alarms are the warnings that Spotlight raises when a metric falls outside its "normal" range of values. A new alarm is raised whenever the severity for a metric changes. When the severity returns to normal, the alarm is canceled.
Alarms are recorded in the Spotlight alarm log pages:
Many Spotlight elements use color to indicate severity.
High
Medium
Low
Normal
Information
Disabled
You can configure Spotlight to notify you of changes to severity through color or intensity, audible warnings, sending email or network notifications or running a program.
| Spotlight elements whose color represents severity | Color indicates | What to do |
|---|---|---|
|
The open/close button on the Spotlight browser
The system tray icon
|
The highest severity currently raised - across all Live (monitored) connections. | Locate the connection in the Spotlight Browser (Live connections). Open the connection's Home Page, Alarm Log or Alarms by Time. |
|
The connection name in the Spotlight browser (Live connections) and connection status bar
|
The highest severity currently raised against the connection. |
Locate the connection in the Spotlight Browser (Live connections). Open the connection's Home Page, Alarm Log or Alarms by Time. |
| The component on the Spotlight home page | The highest severity currently raised against the component. |
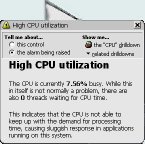
Click on the component to open help regarding the alarm. The text in the help window gives some details about the alarm, why it was raised, and ways in which the problem indicated can be resolved.
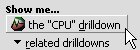
Use the help to open the drilldown page that is directly related to the alarm. Drilldown pages contain charts and tables that you can use to diagnose the cause of the alarm.
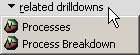
You may like to view one or more related drilldown pages that may be of some value in diagnosing the problem.
Use the information shown in the help window, together with the details shown in the associated drilldown page(s), to discover why Spotlight has raised the alarm. If the alarm is transient, you at least will see where in the system it occurred. If the alarm persists, Spotlight indicates what measures need to be taken to resolve the problem. Note: These actions are customizable. Balloon help |
| The entry in the alarm log page |
The severity of the alarm. |
Alarms are recorded in the Spotlight alarm log pages:
|
Historical alarms
For an alarm raised in the past, view a snapshot of the system as a whole at the time the alarm was raised.
Customize the way that Spotlight handles alarms:
| Option | Description |
|---|---|
| Set new thresholds | You can edit the metric and measures by which an alarm is raised in the Metrics Editor. About Alarms, Metrics, Thresholds And Severities |
| Set action rules |
Govern Spotlight behavior when an alarm is raised. Alarm actions |
| Set filters |
Govern which alarms are displayed. Alarm Filters |
| Ignore specific alarms |