Investigating Latency
The Foglight Cartridge for SAP ASE assists your investigation into latency with the RS_LatencyTabular table view and the RS_Latency_Graph view.
|
• |
Open the RS_LatencyTabular table view to display the Replication Server’s latency information in a table format. There should be one row for each Primary database -Replicate database combination found in each Replicate Database that the monitored Replication Server connects to directly. |
Generating SybaseMDA Reports
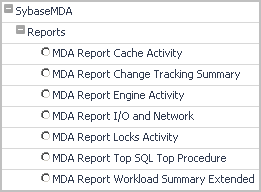
The Foglight for SAP ASE report templates can be found in the following location, when listed by module: SybaseMDA >Reports.
The cartridge comes equipped with the following report templates:
Cache Activity Report
|
• |
Cache Activity Summary shows the cache activity represented by the related metrics in bar charts. This section contains the number of named data caches, their total size, the size of the procedure cache, the maximum available memory, the available physical memory, and the data and procedure cache hit rates. The Data Cache and Procedure Cache hit rates show hit rate averages for the selected time period, along with the related severity level. Different-colored vertical lines in the graphs indicate threshold levels. |
|
• |
Waiting for a memory or buffer summary displays a graph that shows average wait times per sample for a specific class, and a table that lists all the events related to that class that occur during the selected time range. |
|
• |
Cache Graphs Summary contains graphs that indicate the data cache hit rate average, hits, misses and dirty buffers, as well as the procedure cache hit rate average, requests, loads, and writes. |
|
• |
Metrics Statistics Summary shows the a table listing the metrics related to the cache activity. For each metric, the table shows their previous and current values, the baseline minimum and maximum values, and the deviation of the current value from the baseline. The current values appear in bold text for better visibility. Metric groups appear in alternate text color for the same reason. |
|
• |
Data Cache Details show the metrics for each named cache, such as the size in MB, average hit rate, and others. |
|
• |
Data Pools Details show the various metrics for each pool in cache, such as the I/O size, pool size, and others. |
Change Tracking Summary Report
This report takes two special input parameters:
|
• |
stepMinutes: Set this parameter to the period of time in minutes that passes before and after the |
|
• |
beforeAfterMinutes: Set this parameter to the offset in minutes from the change time. This value is very important because it can eliminate a possible negative impact of the retention policy cycle in case the change happens in the middle of retention policy period. In this case, the period average is calculated using the values from the opposite sides of the change. The default retention policy period is 15 min. For example: |
|
• |
Instance Information shows the information about the selected database server, such as its health, user connections, engine, cache, databases running, and others. |
|
• |
Change Tracking Events Compare Graphs list all changes and contain several graphs. The first graph displays the count of changes over time, while the second graph shows the wait events which shows the impact of the changes on the monitored system. For example, an index creation change can help reduce the wait events in general. Other graphs in this section also illustrate how the changes affect the system, such as their impact on the engine and IO activity, and others. |
|
• |
Important Metrics Statistics Summary lists various metrics, grouped into several collections, such as Engines, Processes, SQLs. For each metric, it gives its value before the change and after the change, along with the respective baseline values for the period after the change. It can help understand the impact of one metric change on another. For example, a dramatic decrease in cache misses can be caused by an increased use of APF reads. |
|
• |
System Wait Classes Compare shows in list form the wait classes for the period before the change and after. |
|
• |
System Wait Events shows in list form the system wait events for the period before the change and after. |
|
• |
Change Tracking Events Details Compare contains additional details about the change tracking events. |

